5 tips to increase your Real Estate asset valuation with traffic data
It is sometimes difficult to know the accurate value of a real estate asset, because of the volume and complexity of data to consider. By considering an asset to its accurate value, you will improve its management and make it more profitable. The value of an asset is measured through its income, but also through its economical and physical environment.
You can consider pedestrian and vehicular flow as an advantage when evaluating the economical environment of your shopping centre. Quantifying and qualifying your footfall on precise periods will allow you to support some choices in your development strategy.
You will find in this article 5 possible uses of foot and road traffic data to enhance your asset’s value, and how to measure it thanks to Mytraffic.
1) Analyse average footfall in a shopping centre over a typical week or day
Knowing the visitor’s volume of a shopping centre or shopping area can support different actions. You can for example use this data to:
- accurately value a vacant property and to attract appropriate brands.
- give quantitative metrics to existing or potential tenants. You can then objectively reassess rents (when traffic fluctuates for example).
- anticipate visitation peaks of your shopping centre
- Compare your footfall to competition
Example : Average footfall, day after day
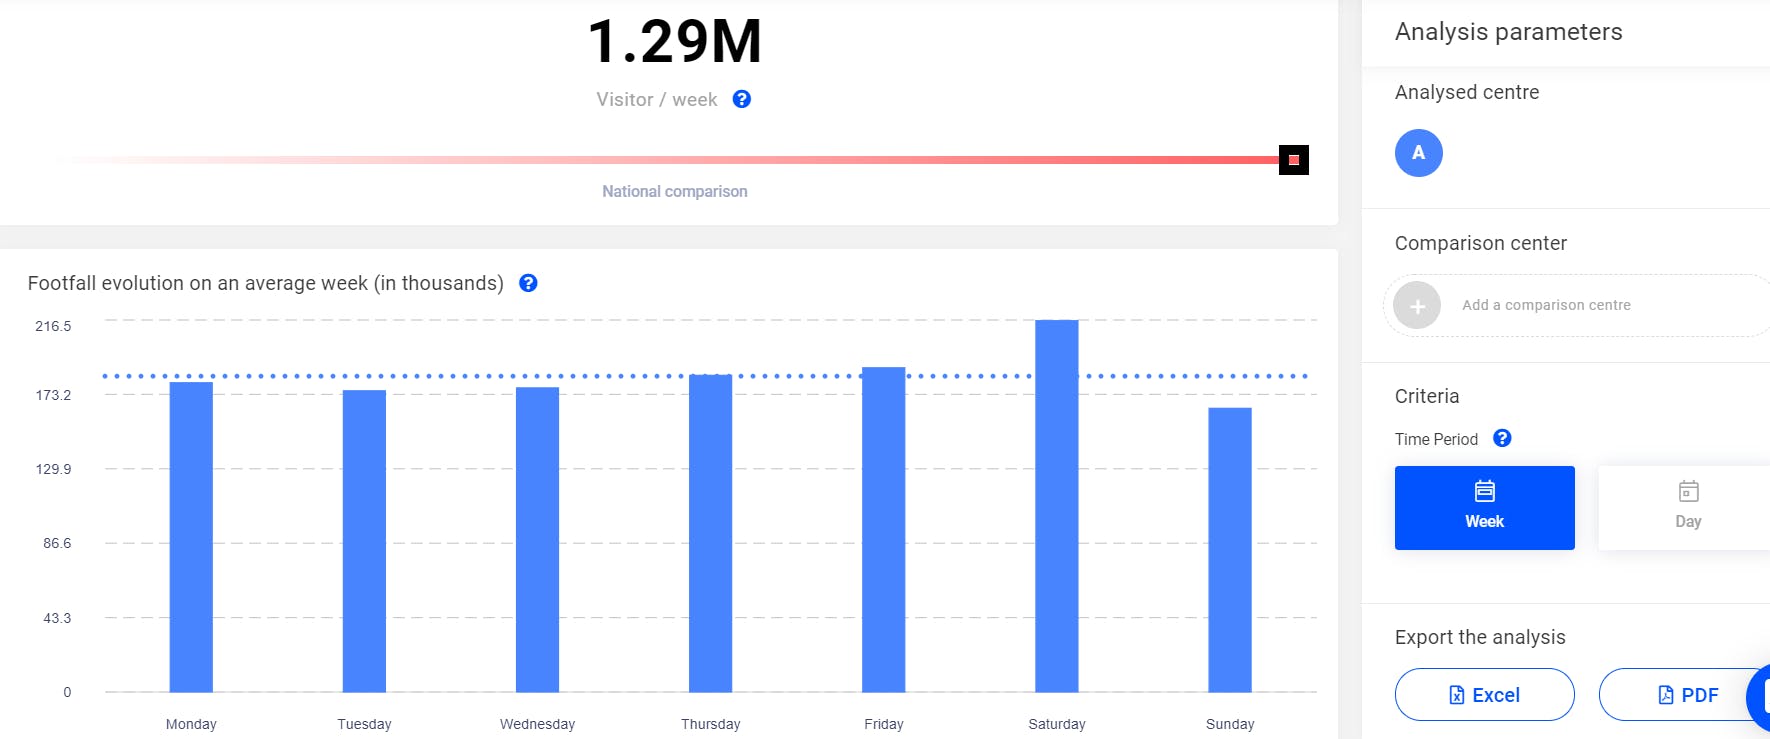
We can see that this shopping centre welcomes significantly more visitors on Saturdays, when looking at an average week.
This data are available in the analysis “Average footfall“ on Mytraffic platform.
2) Keep track of in-door footfall every month
Knowing your weekly and monthly footfall allows you to monitor your asset’s performance and to compare it to your competitors.
By analysing footfall trends, you will have a more accurate vision on :
- Footfall seasonality of your mall
- The impact of your marketing campaigns or events
- Shopping centre’s highlights
Example: Footfall dynamic between June and October 2020, month after month
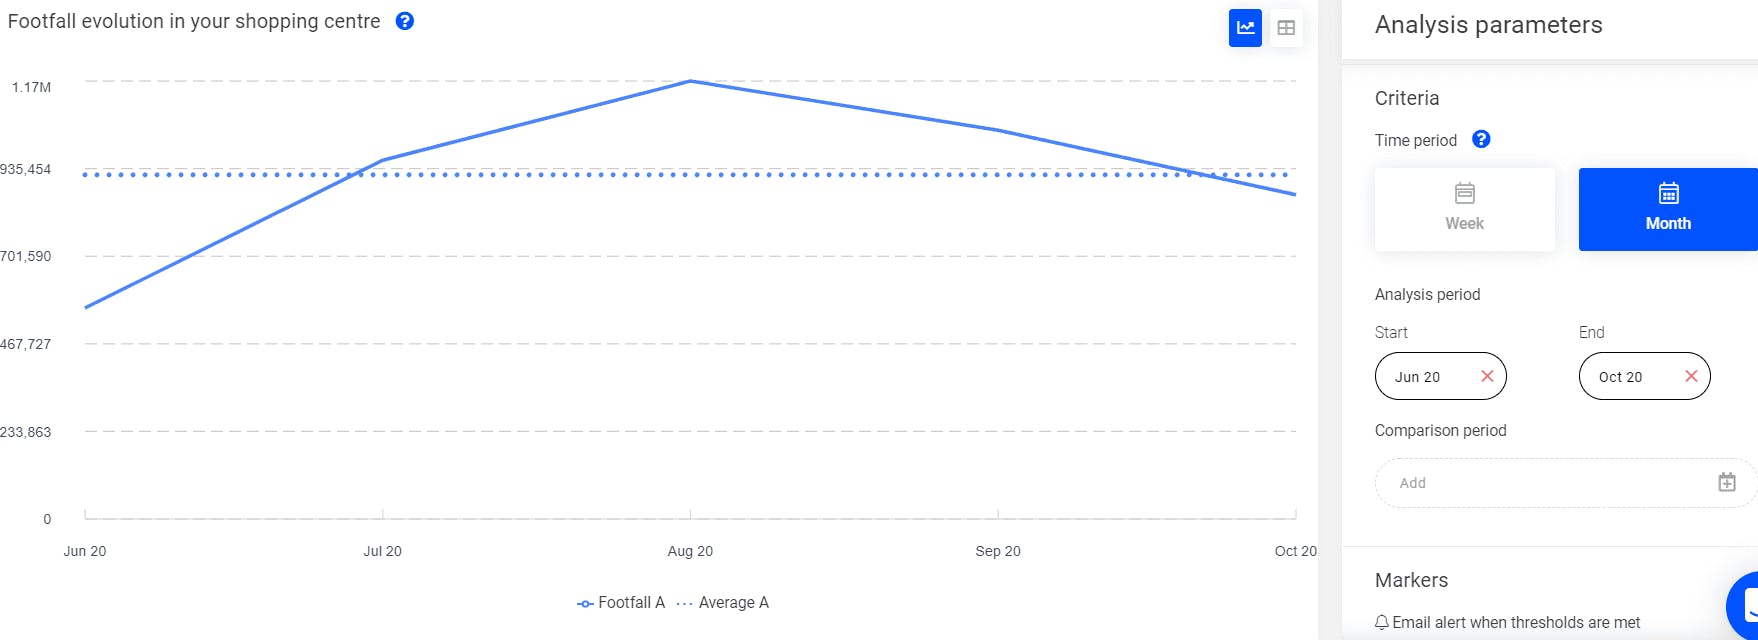
We can see here that more visitors came to this shopping centre between July and August, and that the number of visits tends to decrease since September.
Example: Footfall dynamic between June and October 2020, month after month
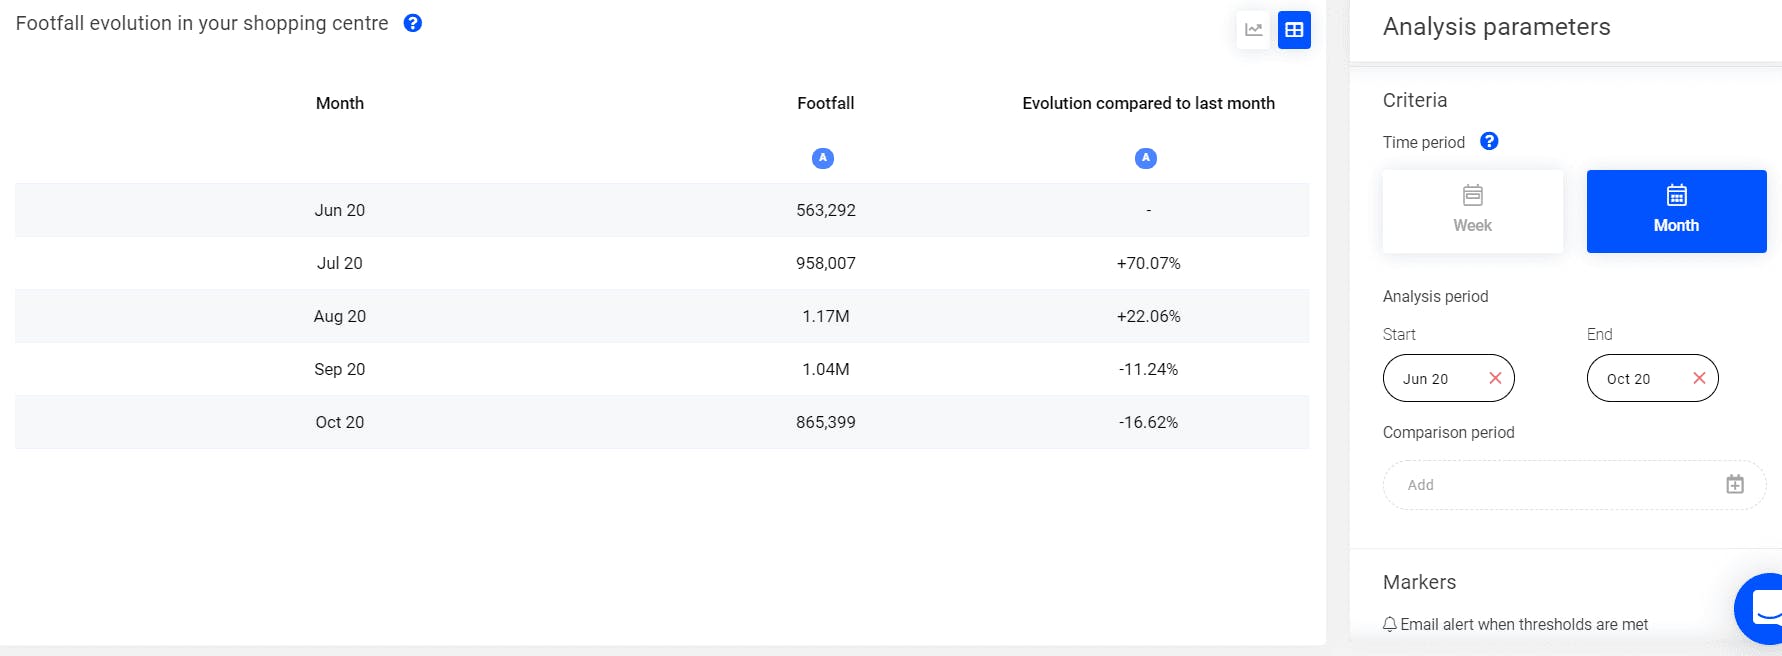
You can also see these data as a table, so you can have a precise look at the variation rate.
This data are available in the analysis “dynamic footfall“ on Mytraffic platform.
3) Establish your real catchment area and penetration rate
The customer catchment area is an essential information to know when assessing the value of an asset. It allows you to know your customers better, by defining their origin. You’ll be able to know the real influence of your shopping centre. By knowing the living and working places of your visitors, and your penetration rate by city, you’ll be able to:
- Observe most penetrated cities or district
- Identify best actions to reinforce footfall in your shopping centre
- Better target local marketing campaigns
- Guide media agencies in the location of advertising spots
Example: Top 10 provenance neighbourhoods for a shopping centre in June and October 2020
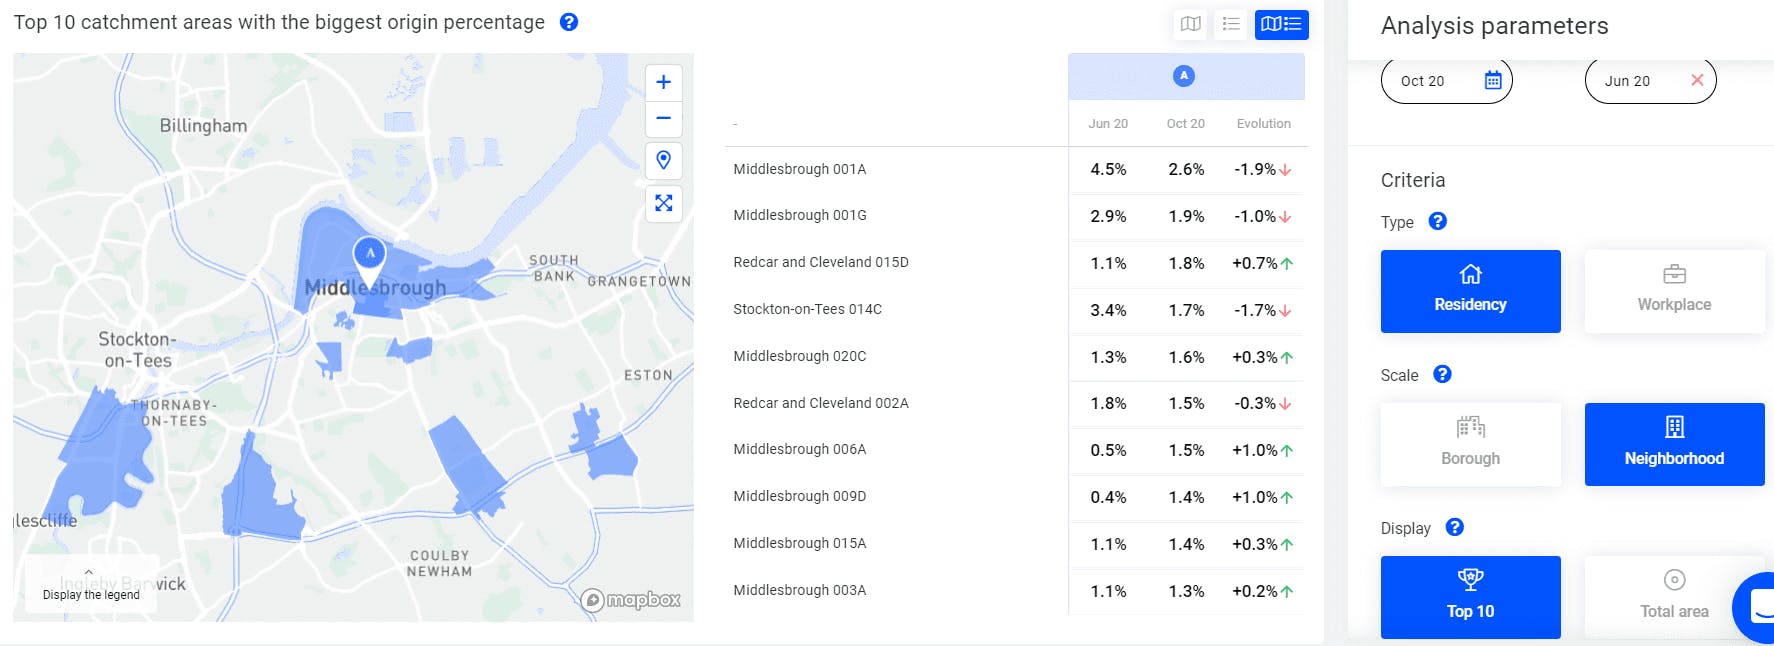
We can observe here in blue the top 10 residency place of the shopping centre, and their evolution between June and October 2020
Example: Top 10 neighbourhood with the best penetration rates
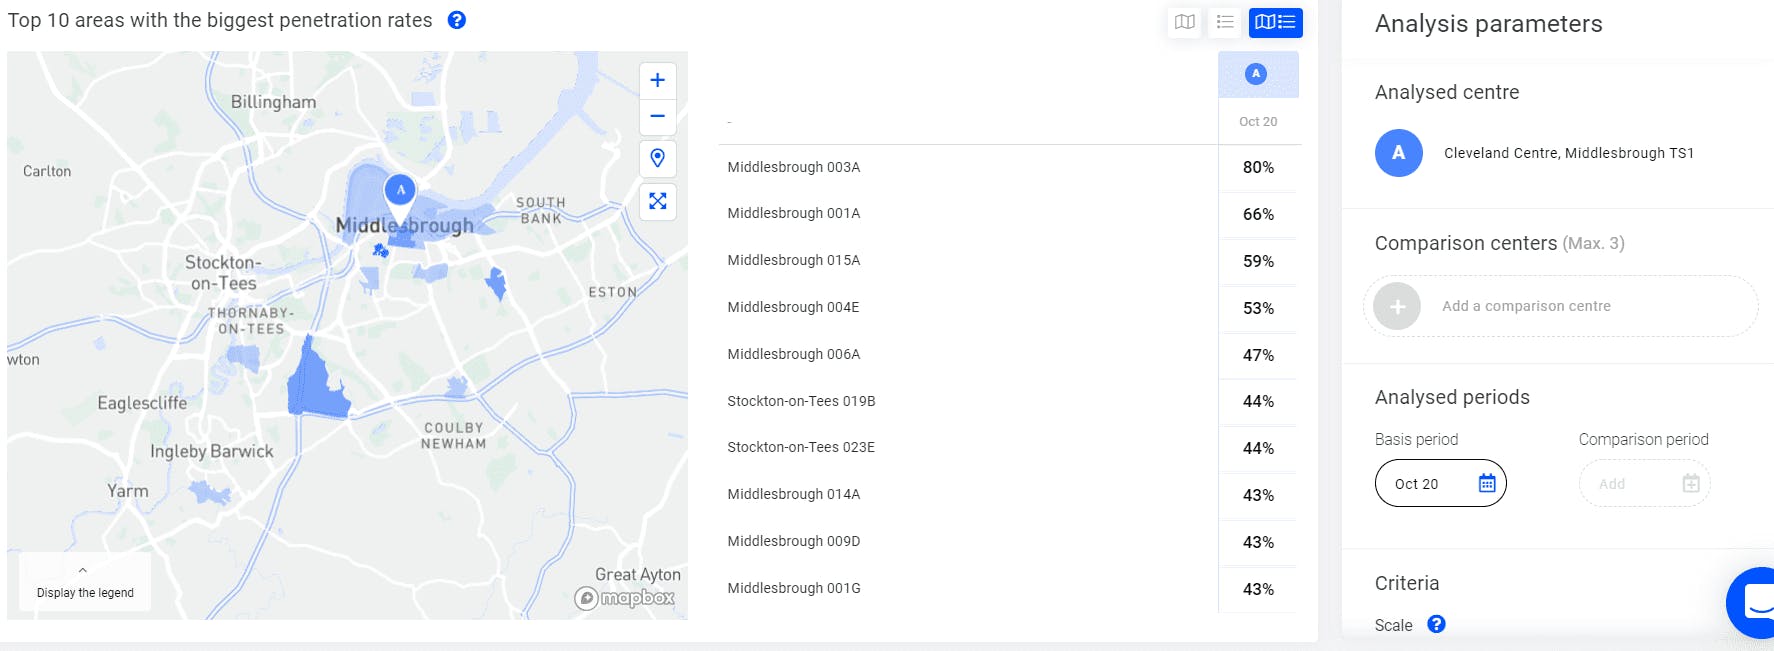
The analysis “origin” and “penetration rate” give you access to these information in the Mytraffic app.
4) Identify competitor's shopping centres and the part of your visitors going there
Which part of your visitors are also going to competitor’s centres? This data is important to develop and restructure an asset. You will know which of your centres are highly competitive, and therefore adapt local strategies (diversify your offer, change your commercial or marketing strategy…).
Knowing cannibalisation rate between two centres will also help you to convince retailers, by proving to them that the targeted people are not the same as in a centre they are already in.
The analysis “Shared visitors” in the Mytraffic app gives you access to this comparison.
5) Understand your visitors' socio-demographic profiles
The profile of your clients is sometimes difficult to identify. To help you determine typical profiles, you can lean on information like:
- The volume of your addressable market
- The spending power of this addressable market
- The age and gender of your clients
Knowing better your visitors allows you to:
- Ensure that brands installed in your centre matches with your clients' profiles
- Adapt your speech and arguments to attract corresponding brands
- Adapt your development strategy
Example: evolution of the socio-demographic profile of visitors between October 2019 and October 2020
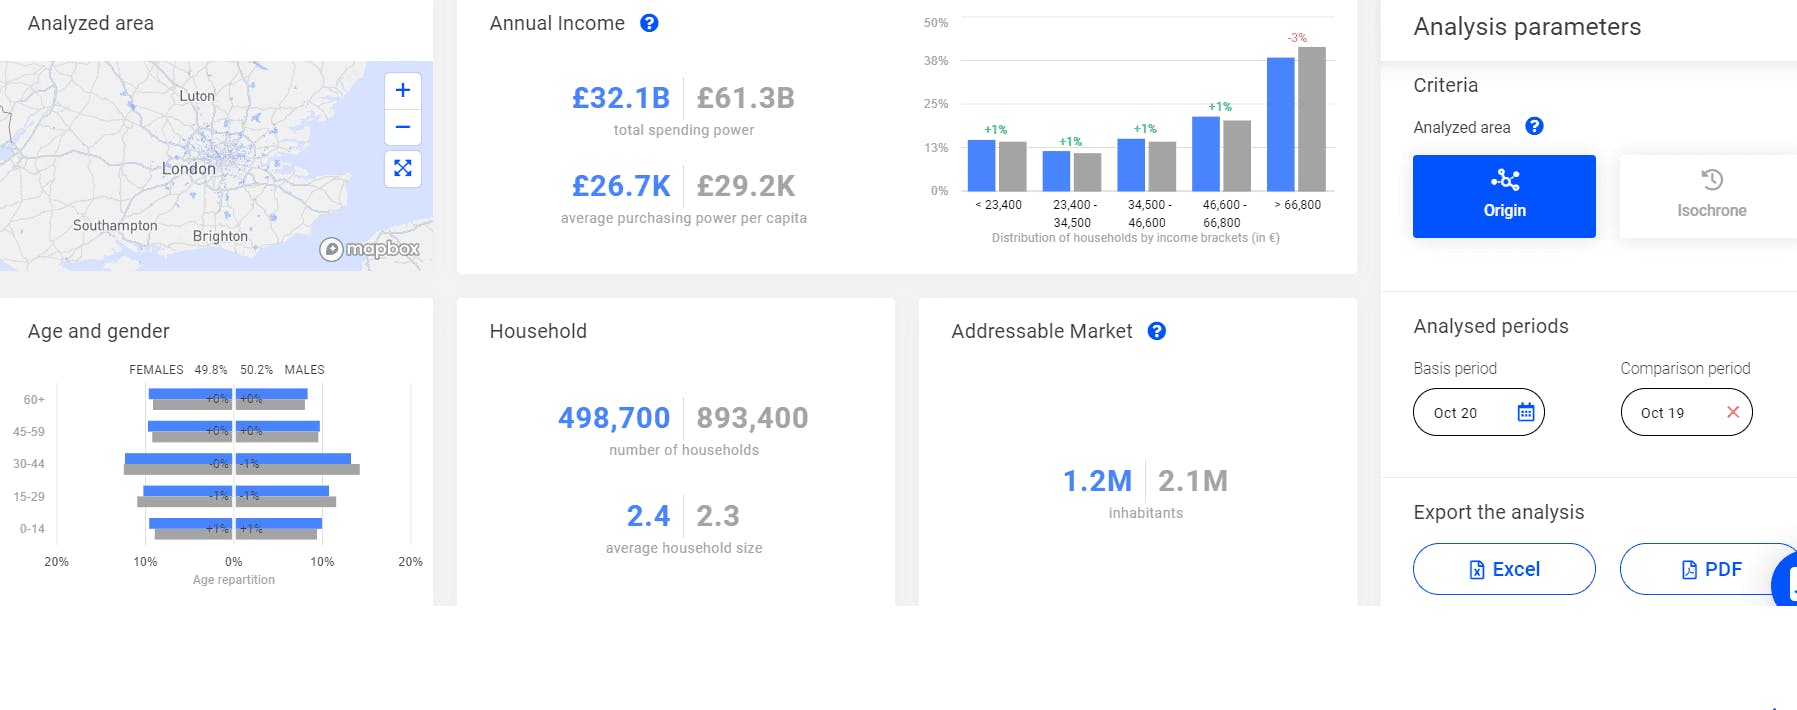
2020’s data are blue, 2019’s are grey. We observe here a decrease in the addressable market,.
You can access this dashboard in the analysis “socio-demographic profile”.
In every analysis available on Mytraffic, you can compare data with competitor centres and compare precise time-range.
To resume
Foot traffic data are a major asset in the understanding of the environment and performances of a shopping centre.
By studying these traffic data, you have a better visibility on your shopping centre’s visitors. You can then:
- Measure the exact volume of visitors of your centre
- Understand trends and evaluate the impact of marketing actions
- Assess your real catchment area
- Estimate your penetration rate on your catchment area
- Understand cannibalisation rate with your competitors
- Determine socio-demographic profile of your visitors
With these data, you can (among others):
- Adjust development strategies
- Attract the right brand to your centre
- Determine rents objectively
- Improve and measure results of your marketing actions
You want to understand the footfall in your shopping centre and improve your asset management? Ask for a Demo