


.jpg)


Follow us on
What European Foot Traffic Tells US Stock Traders
Wall Street watches earnings calls. We watched the front door.
Earnings are backward-looking by design. They describe what happened last quarter, packaged into a narrative the IR team has had weeks to polish. By the time the numbers hit your screen, the market has usually already moved on whatever analyst consensus predicted.
The question that actually matters, what's happening right now, at store level, before anyone files anything, is the one that's hardest to answer.
Foot traffic answers it. Not perfectly, and not for every brand. But for American companies with significant European store networks, monthly visit data from London, Paris, Madrid, Milan, Frankfurt, Brussels, and Amsterdam contains a behavioral signal that shows up in the stock weeks before it shows up in reported revenue.
That's the hypothesis we tested.
Over the full year 2025, we used Gini by MyTraffic to track 25 publicaly traded US-listed retailers and F&B companies across 14 European markets, then compared monthly footfall changes to monthly stock returns across time lags of 0 to 3 months. The dataset is exploratory (25 brands, over a year) and we're not claiming a prediction engine.
What we found were patterns specific enough to be worth examining.
American traders have a European blind spot
The alternative data market reached $11.65 billion in 2024 according to Grand View Research, with hedge fund operators accounting for 68% of end-user demand. Location and geo-location data is one of the fastest-growing data types in that stack. The problem: the dominant providers (Placer.ai, SafeGraph, Foursquare) are built around US location data. They have little to no coverage of European physical retail.
For an equity analyst tracking Chipotle or Starbucks, that means a meaningful slice of store-level consumer behavior is simply invisible. Gini covers 14 European markets with deep, consistent, historical data going back years.
The same data, available in real time, that powered this study.
What we measured
Each month in 2025, we recorded the year-over-year change in European store visits for each of the 25 brands, then measured the correlation with stock price changes at the same month, one month ahead, two months ahead, and three months ahead. The goal was to find where signal strength, if any, was highest.
The study is honest about its limits: 25 brands over 12 months is a starting point, not a validated model. Larger datasets and multi-year backtesting would be needed before drawing hard conclusions.
What you can do with this data is pattern detection and a few of the patterns are sharp enough to be worth building on.
F&B is where the signal concentrates
Across all 25 brands, the correlation between this month's footfall and next month's stock return came out at r=+0.09.
Directionally there, but too weak to act on.
When we isolated the F&B names (McDonald's, Starbucks, KFC, Domino's, Chipotle, Shake Shack, Wendy's, Restaurant Brands, Krispy Kreme) the signal doubled. Sector correlation hit r=+0.19 at a 1-month lag, with a p-value of 0.06.
The reason is structural. Restaurant revenue runs almost entirely through the front door. There's no e-commerce channel absorbing demand, no wholesale business generating revenue regardless of store traffic, no licensing revenue smoothing the quarterly P&L. When fewer people walk into a KFC in London, it shows up in revenue and then in the stock.
Multi-channel retailers like Ralph Lauren or Tapestry have too many other revenue levers for European footfall to tell a clean story on its own.
r=+0.19 isn't a strong correlation in absolute terms. But the direction is consistent, the sector logic is tight, and the p-value is close enough to conventional significance thresholds that it warrants attention. For pure-play F&B names with meaningful European exposure, this is a data layer worth adding to the research process.
As part of the broader picture of how foot traffic data reveals visitor behaviour in commercial real estate, the F&B finding reflects a pattern that holds consistently across contexts: the more a business depends on in-person visits, the more predictive footfall becomes.
Declining footfall is the cleaner warning
The most reliable finding in the dataset isn't about the overall correlation, it's about the asymmetry between rising and falling traffic.
We isolated every brand-month where European store visits dropped more than 5% year-over-year, then tracked what the stock did the following month:
After months of strong footfall, the stock went up only 44% of the time — barely better than a coin toss.
Bad news cuts through faster than good news. When European stores start emptying out, the market tends to reprice within weeks, even without a formal earnings update to trigger it. Good news from the same data is noisier and slower to show up in share prices.
The practical implication: European foot traffic data is more valuable as an early warning system than as a buy signal. A sharp drop in visits across European locations is a data point worth flagging — because the market often hasn't absorbed it yet.
Six brands, real numbers
Not every brand in the study produced a signal. Twelve of the 25 showed no meaningful relationship between European footfall and stock direction. But six produced correlations below p=0.10, meaning the relationship is unlikely to be random at standard exploratory thresholds:
Lags were identified post-hoc, not set in advance. These are exploratory fits, not validated predictive models.
Chipotle is the clearest case in the dataset. In September 2025, European store visits collapsed by 12.6% year-over-year. One month later, Chipotle's Q3 earnings confirmed a broad traffic decline across all income cohorts. The company cut its full-year guidance for the third consecutive quarter. The stock fell 19.1% (its worst month of 2025).
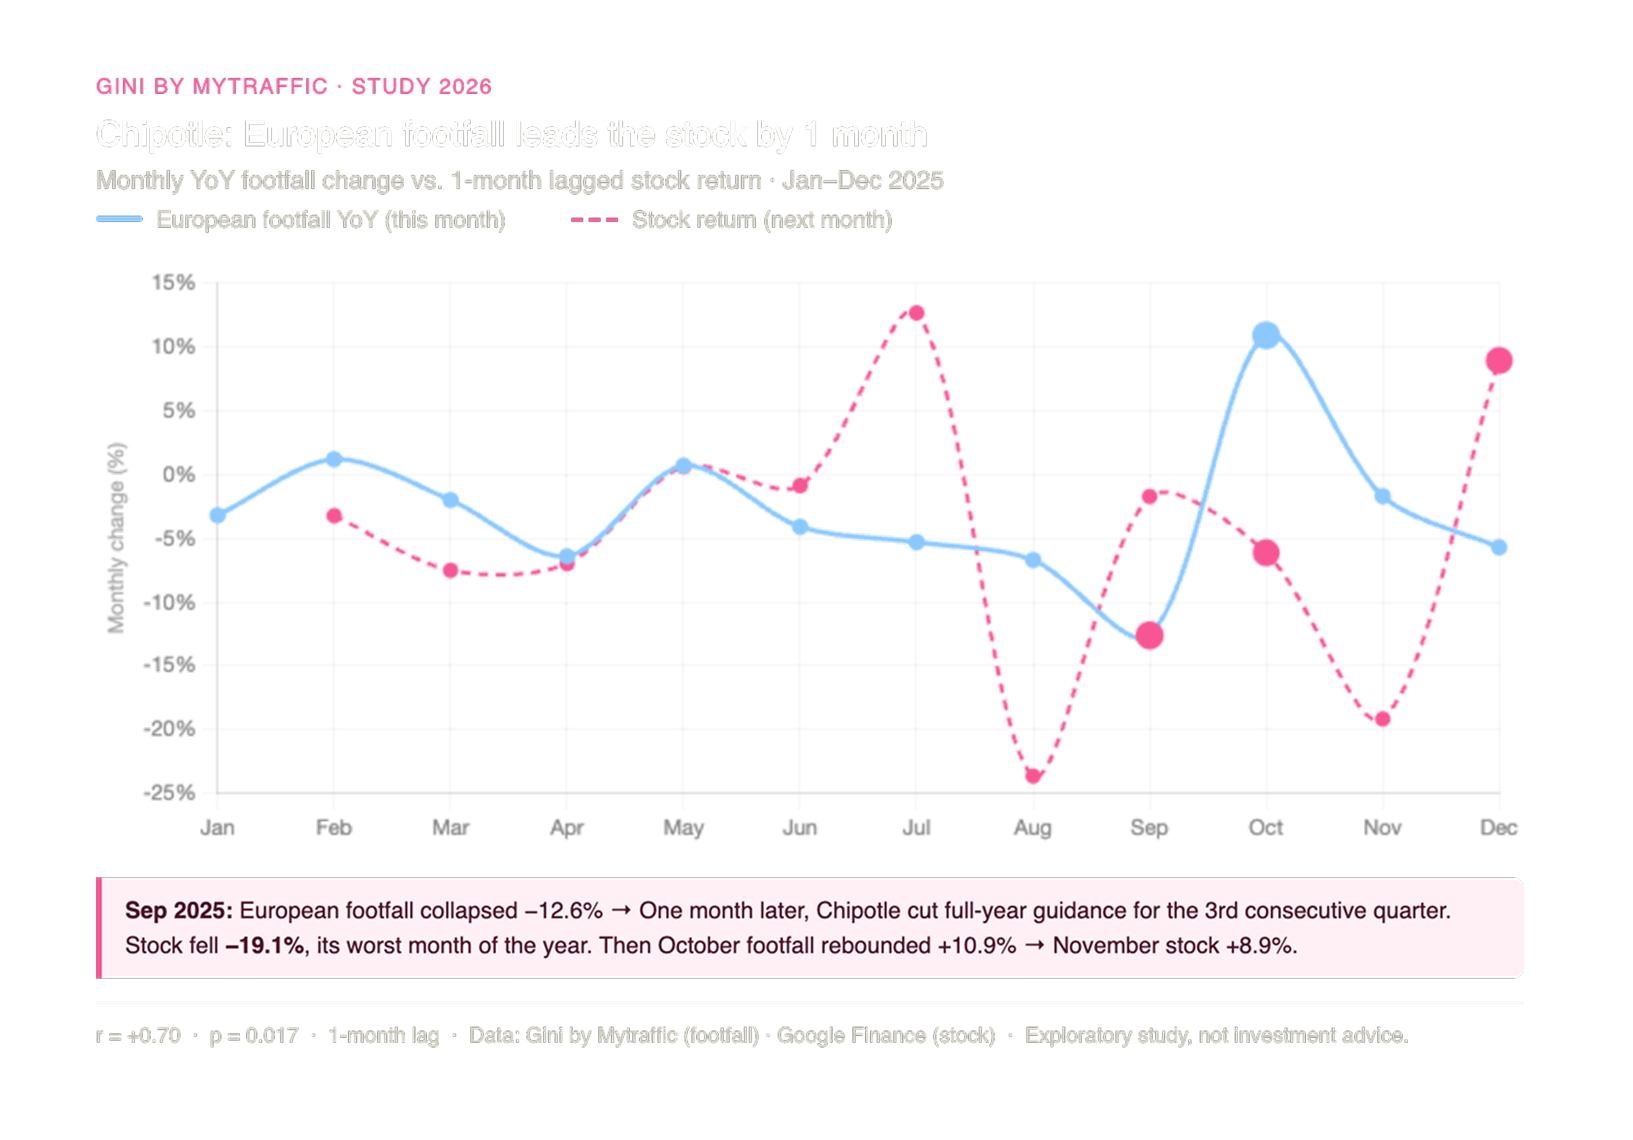
Then the reverse: October footfall rebounded by 10.9%. November's stock returned +8.9%.
Apple's 3-month lag is consistent with its quarterly earnings cycle. European store visits are one input among many for a company that size, but the 3-month feedback loop tracks closely with how long it takes for in-store behaviour to work through reported results.
Where the signal breaks and why that's useful
12 of 25 brands showed a mismatch between European footfall direction and stock direction. Understanding where the data stops working is as important as understanding where it works.
Corporate events override everything else. Krispy Kreme had mildly positive European footfall in 2025, averaging +0.9% monthly. Its stock fell 59.5% because the company was taken private. Bath & Body Works showed positive European traffic but dropped 48.2% on a restructuring announcement. No amount of store visit data predicts a board decision.
Revenue mix dilutes the signal. Ralph Lauren and Tapestry both saw declining European footfall, but their stocks rose, wholesale revenue and licensing in other regions offset the European retail story. Estée Lauder moved almost entirely on China recovery sentiment throughout 2025. When European stores represent a small fraction of total revenue, European footfall tells you very little about the stock.
Flat footfall produces no signal. When monthly visits are essentially unchanged year-over-year, there's nothing to read. McDonald's, Starbucks, and Restaurant Brands all had near-zero footfall changes for most of the year, which is why Starbucks only made the list of six in months when traffic moved sharply.
The filter this creates is actually useful: European foot traffic carries a meaningful signal when European stores are a primary driver of business performance. The more a company's stock is driven by factors outside European physical retail, wholesale, licensing, M&A activity, exposure to Asia, the weaker the connection. Knowing which brands sit on which side of that line tells you where to focus.
This is consistent with what we see across retail benchmarking and competitive intelligence analysis more broadly: foot traffic signals are most actionable when physical stores are the core mechanism of revenue generation, not one channel among many.
The data no American competitor has
Placer.ai has built an entire section of its platform around the finance and investment use case. So has SafeGraph. Both are good products for tracking US consumer behavior. Neither covers European physical retail in any meaningful depth.
Gini by MyTraffic tracks foot traffic across 14 European markets as well as the US, with data going back years, not months. That historical depth means the signals in this study aren't theoretical: they can be backtested across multiple years and market cycles. The data is live and updated in real time, for thousands of brand locations across Europe.
For US-listed companies with significant European store networks, this is a data layer that doesn't exist anywhere else. As this study shows through analyzing foot traffic to better understand commercial networks, the value isn't just in the correlation numbers, it's in having behavioral visibility into a market before it shows up in a 10-Q.
The question this study opens isn't whether foot traffic predicts stocks with certainty, no single data source does, and anyone selling you that certainty is lying. The question is whether European footfall adds a signal to an existing research process. For F&B companies, for brands where European stores drive revenue, and specifically when that footfall is dropping sharply, the 2025 data suggests it does.
Download the full study: European Foot Traffic as an Early Signal for US Stock Performance
To resume
We tracked 25 US-listed retailers and F&B brands across 7 European markets for all of 2025, testing whether monthly European foot traffic changes could predict US stock moves.
The headline finding: the signal is real but narrow. Across all 25 brands, the correlation between footfall and next month's stock return was weak (r=+0.09). Isolate F&B names only and it doubles (r=+0.19, p=0.06), because restaurant revenue has no e-commerce buffer to absorb a drop in store visits.
The asymmetry finding is the most actionable: when European visits fell more than 5% year-over-year, the stock dropped the following month 61% of the time, with an average return of -2.5%. Rising footfall barely beat a coin toss at 44%. Six brands showed statistically meaningful correlations (p<0.10), led by Chipotle at r=+0.70, in September 2025, European footfall collapsed -12.6%, and one month later the stock fell -19.1%.
The signal breaks where you'd expect: corporate events (Krispy Kreme taken private), revenue mix dominated by other geographies (Estée Lauder on China), or flat footfall with nothing to read. The strategic point: Placer.ai, SafeGraph, and Foursquare are built around US data. None of them covers European physical retail. For US-listed brands where European stores actually drive revenue, this is a data layer that simply doesn't exist anywhere else.