


.jpg)
.jpg)

Follow us on
Before opening your next location, the answer is already inside your existing network. Your current stores contain the full DNA of what works, and what doesn't, in every market you're about to enter.
Retailers who expand fastest don't guess better. They read their existing data better. They extract the patterns hiding in their current locations, build a replicable model from those patterns, and use it to score every potential site before signing a lease.
This article shows exactly how to do that, using Action, Europe's fastest-growing non-food discount retailer, as a concrete example.
Why do most retail expansions fail before they start?
Most retail expansion failures are location failures. The decision to open in the wrong place, with the wrong customer profile, at the wrong traffic rhythm, accounts for a disproportionate share of underperforming stores.
According to the Bureau of Labor Statistics, around 42% of retail businesses fail by their fifth year. A consistent finding across retail site selection research is that location ranks among the top three reasons for store failure, often outweighing factors like pricing or promotional tactics. The wrong site produces poor performance even when the product and brand are strong.
The irony is that most retailers already hold the data they need to avoid these mistakes. It lives in their existing store network: in the footfall curves of their best-performing locations, in the demographic profiles of the catchment areas that consistently convert, in the traffic rhythms that determine whether a store should open at 8:00 AM or 10:00 AM.
The retailers who crack expansion don't rely on instinct or broker recommendations alone. They treat their existing stores as a laboratory, and they build their expansion model from what that laboratory tells them.
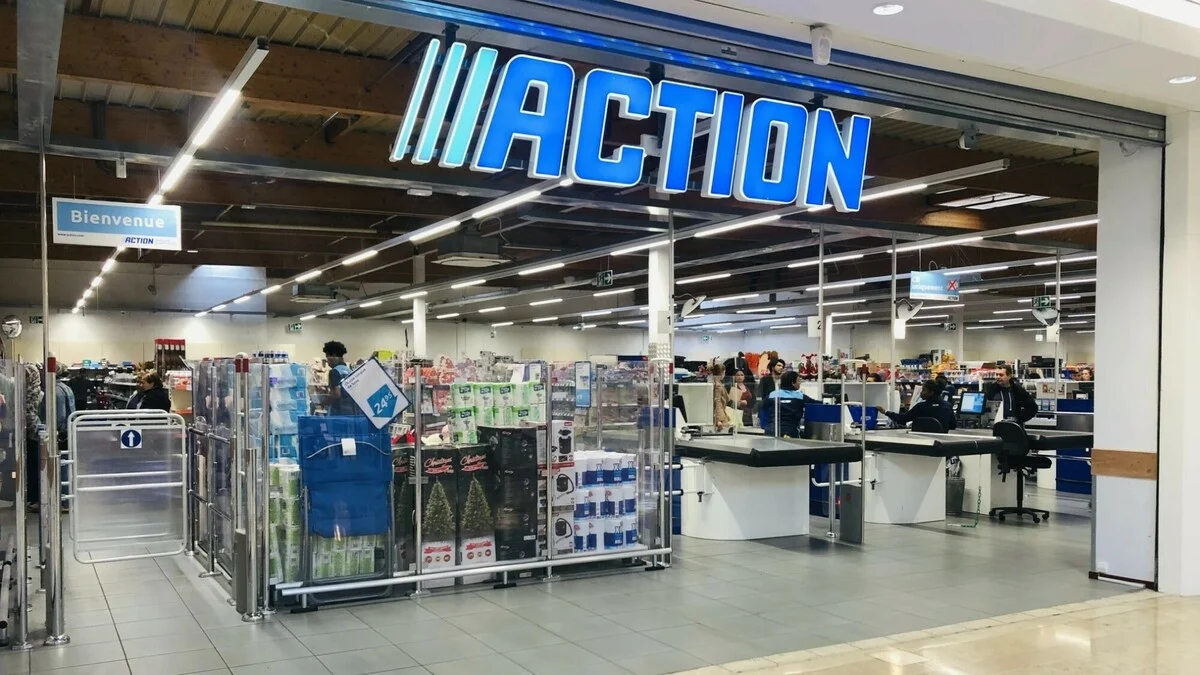
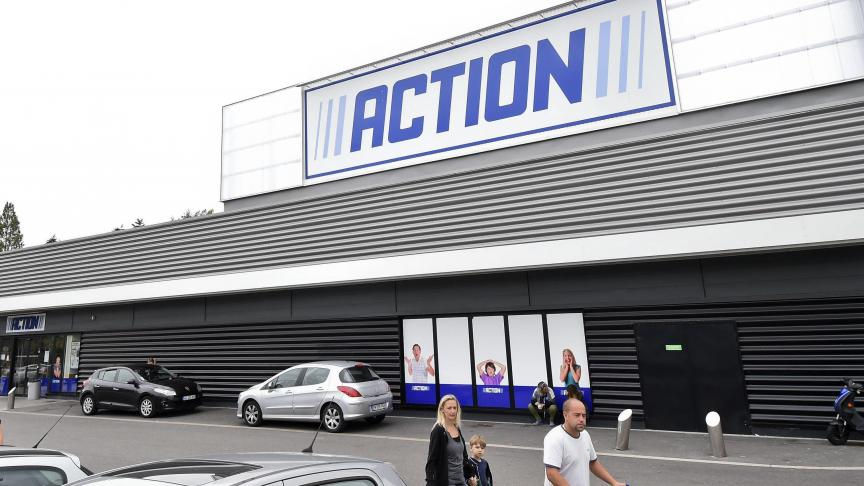
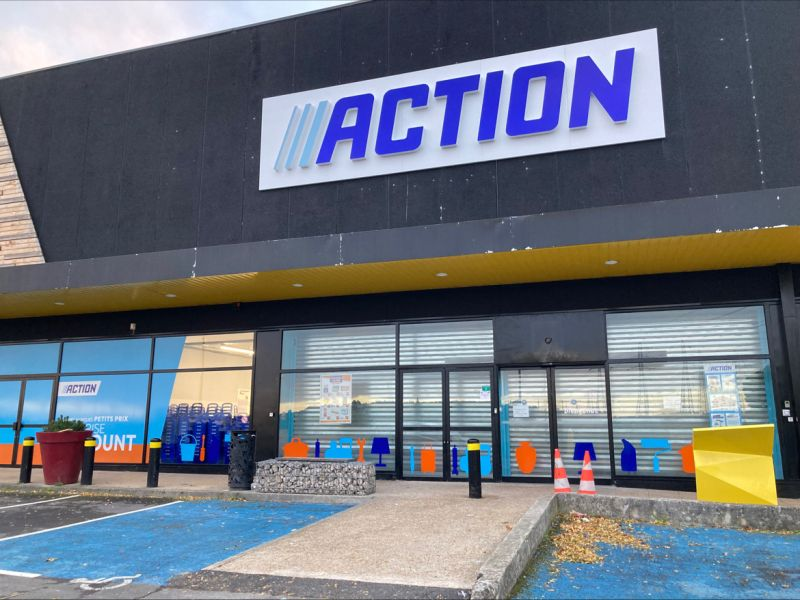
Action is one of the clearest examples of this discipline in Europe right now.
What does Action's expansion tell us about disciplined retail growth?
Action has grown from a single Dutch discount store in 1993 to 3,139 locations across 14 European countries by late 2025, opening an average of more than one new store per day.
According to Action's official 2024 results, the company ended the year with 2,918 stores across 12 countries, having added 352 locations in twelve months alone. Net sales reached €13.8 billion in 2024, up 21.7% from 2023, with like-for-like growth of 10.3% confirming that existing stores continued to perform as new ones were added. As of late 2025, Action is welcoming an average of 20.6 million customers per week across its network.
This growth rate is not accidental. It requires a replicable location model, one that can be applied consistently across countries with different demographics, traffic patterns, urban densities, and consumer behaviours. Without that model, the risk of cannibalization and underperformance scales with every new store opened.
The question worth asking is: what does Action's existing network actually reveal about where and how it succeeds?
What does footfall data reveal that sales data alone cannot?
Footfall data shows you when and how customers use a store, not just whether they buy. These behavioural patterns, not revenue figures, are what determine whether a new location will work.
Take two Action stores analyzed using Gini by Mytraffic's location intelligence data:
- Action Lille Lillenium, 2 Rue du Faubourg des Postes, Lille
- Action Villebon-sur-Yvette, 2 Avenue de la Plesse, Villebon-sur-Yvette
The footfall curves for these two stores tell two different stories about the same brand. The Lille store shows peak traffic patterns that suggest opening hours from 8:00 AM to 7:00 PM would capture the majority of its daily visits. The Villebon-sur-Yvette store, by contrast, shows a later rhythm, with optimal opening hours running from 9:00 AM to 8:00 PM.
One hour of difference. Potentially significant revenue difference if missed.
This kind of analysis produces two immediate, actionable outputs:
First, it optimises existing store operations. If a store is opening an hour before its customers arrive, that is a direct operational cost with no return. Adjusting opening hours to match actual traffic curves reduces waste and improves staff allocation.
Second, and more importantly for expansion, it reveals the type of location each store sits in. A store that attracts early-morning traffic is likely in a high-footfall transit or commercial zone. A store with a later, longer peak is more likely surrounded by residential neighbourhoods where customers shop on their own schedule. Both are valid markets for Action. But they require different site profiles, different lease negotiations, and different operational setups.
This is the kind of signal that sales data cannot give you. Revenue tells you what happened. Footfall tells you why, and when, and who.
What demographic patterns predict a store's catchment area fit?
The most predictive demographic factor for a value retailer like Action is not population density. It is price sensitivity, and the clearest proxy for price sensitivity in a catchment area is the proportion of younger adults aged 18 to 24.
Analysis of the two Action stores above using Gini by Mytraffic data shows that both locations sit in catchment areas where the proportion of residents aged 18 to 24 is higher than the national French average. This is not a coincidence.
This age cohort has systematically lower disposable income than older segments. They are students, early-career workers, and young families making their first independent purchasing decisions. Action's value proposition, a wide selection of non-food products at prices significantly below branded alternatives, resonates with exactly this profile.
The strategic implication is direct: when Action scouts a new location, finding areas with an above-average concentration of 18 to 24 year olds is a strong positive signal. Not the only signal, but a consistent one across high-performing stores.
Three demographic factors consistently predict catchment area fit for a value retailer:
Age distribution. A higher proportion of 18 to 34 year olds correlates with stronger price sensitivity and higher visit frequency for value formats.
Income levels. Median household income below the national average in the immediate catchment area (typically a 500-metre to 1-kilometre radius) reinforces the relevance of the value proposition.
Residential density. Value retailers perform best in locations with high residential density within walking or short-drive distance, rather than purely commercial or tourist zones where visit purpose and basket composition differ significantly.
These three signals, read together against your existing high-performing stores, give you a demographic fingerprint for your ideal location. That fingerprint is what you apply to every prospective site before committing.
How do you turn store analysis into a replicable expansion model?
A replicable expansion model has three components: a demographic filter, a traffic profile, and a competitive context score. When all three align with your best-performing stores, a new site has high potential. When one is missing, you investigate before committing.
Here is the practical process:
Step 1: Define your benchmark stores. Select the 10 to 15 stores in your existing network that consistently outperform the average on the metrics that matter most to your business: footfall volume, footfall consistency across the week, conversion rates where measurable, and sales per square metre. These are your proof of concept.
Step 2: Build the demographic fingerprint. For each benchmark store, extract the demographic profile of the 15-minute catchment area: age distribution, income bands, household composition, and population density. Look for the patterns that repeat across your best stores and are absent or weaker in your underperformers. For Action, the 18 to 24 age concentration and below-average income profile appear consistently in high-performing French locations.
Step 3: Map the traffic rhythm. Use external footfall data to understand the hourly and weekly traffic curves of each benchmark store. Identify the traffic type: is it driven by commuter flow, by proximity to other retail anchors, by residential density, or by a combination? Each type has different implications for lease negotiation and operating model.
Step 4: Score competitive context. Assess the density and strength of direct competitors within the same catchment area. A location with strong demographics and good traffic but three direct competitors within 300 metres carries a different risk profile than one with the same demographics and traffic and no direct competition.
Step 5: Apply the model to prospective sites. When evaluating a new location, run the same four filters. Sites that match your demographic fingerprint, align with your preferred traffic type, and carry low competitive risk are your highest-confidence bets. Sites that match on two of three require deeper investigation. Sites that match on one or fewer should be deprioritised, regardless of what the broker says about the neighbourhood.
This process converts expansion from a judgment call into a structured decision with documented logic. It is reproducible across markets, scalable across teams, and defensible to internal stakeholders who need to approve location investments.
How can Gini by Mytraffic accelerate your network expansion?
Gini by Mytraffic gives retail expansion teams access to footfall data, demographic intelligence, and competitive mapping for over 10 million locations across Europe, accurate to 10 metres, without waiting for a custom study.
The analysis described above, demographic fingerprinting, traffic curve comparison, competitive context scoring, is exactly what Gini by Mytraffic is built to deliver, across France, Spain, Germany, and every market where Action, and retailers like Action, are actively expanding.
Two workflows are directly relevant to the expansion use case:
Site Selector allows you to analyse any address with key performance metrics, compare it against your benchmark locations, and receive a structured recommendation. Instead of evaluating five potential sites with five separate broker visits and three weeks of internal analysis, you assess them in parallel against the same criteria in one session.
Expansion Planner takes the process further. Input your expansion criteria, your preferred demographic profile, your traffic requirements, your competitive thresholds, and Gini maps the territory to surface the locations that match. It turns a market entry question into a ranked list of candidates with supporting data.
Over 600 companies across Europe use Mytraffic's location intelligence to make network decisions. The data covers 9 countries, 10 million analysed locations, and delivers accuracy to 10 metres, which matters when the difference between a location that catches commuter traffic and one that misses it is sometimes a single block.
If you want to apply this methodology to your own network, the fastest way to start is a free footfall analysis of your existing stores. That analysis alone will show you the patterns that should be driving your next expansion decision.
Frequently asked questions
What is a key success factor analysis for retail expansion?
A key success factor analysis examines your existing store network to identify the demographic, traffic, and competitive conditions that consistently appear in your highest-performing locations. The output is a replicable site profile used to evaluate and score prospective new locations before committing to a lease.
How do you use footfall data to validate a new retail location?
Compare the traffic curve of the prospective site against the curves of your benchmark stores. Look for alignment in peak hours, daily visit patterns, and weekly rhythm. If the traffic profile of the new site matches your best-performing locations, it is a positive signal. If it diverges significantly, investigate the reason before committing.
What demographic data matters most for a value discount retailer?
For value formats like Action, the most predictive demographic signals are the proportion of residents aged 18 to 34 in the catchment area, median household income relative to the national average, and residential population density within a one-kilometre radius. These three factors correlate strongly with the price sensitivity and visit frequency that drive performance in value retail.
How long does it take to build a replicable expansion model?
With the right location intelligence data, the core analysis of 10 to 15 benchmark stores can be completed in days rather than weeks. The model is not a one-time exercise. It should be updated as your network grows and as new high-performing stores confirm or refine the original fingerprint.
What is the difference between footfall data and sales data for site selection?
Sales data tells you what happened at a location after it opened. Footfall data tells you what to expect before you open, based on how people already move through and around a prospective site. For site selection, footfall data from the surrounding area is more predictive than historical sales data from nearby stores, because it reflects actual human behaviour rather than past business performance.