

.jpg)
.jpeg)
.jpg)
.jpg)

Follow us on
Foot traffic data reveals who actually visits an area, where they come from, which nearby retailers share your customers, and how your competitors are performing, before you even sign a lease.
The retailers winning the best locations right now are not smarter than the ones losing them. They have better information. Foot traffic data has become the clearest edge in site selection, and the gap between teams that use it and teams that don't is widening fast.
This is the playbook they're running.
Why is site selection still the highest-stakes decision in retail?
Three things have made getting this right more important than ever.
Rent is at record highs, and your margins have no room for a mistake.
The average retail asking rent in the US hit $34.47 per square foot in Q4 2024, up 1.6% year over year, according to Colliers' US Retail Market Report. National vacancy sits at 4.1%. In the tightest markets, landlords are taking lease commitments three years before a space comes available. You're competing for locations that don't exist yet. Meanwhile, NYU Stern's January 2024 data puts the average net profit margin for US general retail at 3.1%. A 3,000 sq ft location at market rate, over a standard lease term, represents over $1M in committed rent. One bad call at that margin level doesn't just hurt, it can wipe out years of profit from your better stores.
Leases are getting longer.
CBRE's November 2024 analysis found the average US retail lease term rose to 96 months in 2024. That's 8 years! Retailers with smaller footprints (1,000 to 4,999 sq ft) locked in at 95 months on average, nearly a year longer than 2023. You're not running a 24-month experiment you can exit. Every site decision is a long commitment in a market that keeps moving.
Your competitors are already using data.
The best-run retail real estate teams now score candidate sites before a site committee ever meets. They're mapping trade areas with mobile visit data, benchmarking competitors' performance, and stress-testing cannibalization risk with quantitative models. If your process still runs on radius maps, census demographics, and the judgment of whoever drove by on a Tuesday, you're showing up to a data fight without data.
One more thing worth knowing: a physical store does more than sell. ICSC's Halo Effect III research, covering $850 billion in credit card transactions across 2,103 stores, found that opening a new store lifts online sales in that market by 6.9% on average. Closing one cuts online sales by 11.5%. The wrong location costs you more than the lease.
What does foot traffic data reveal that census data and gut instinct can't?
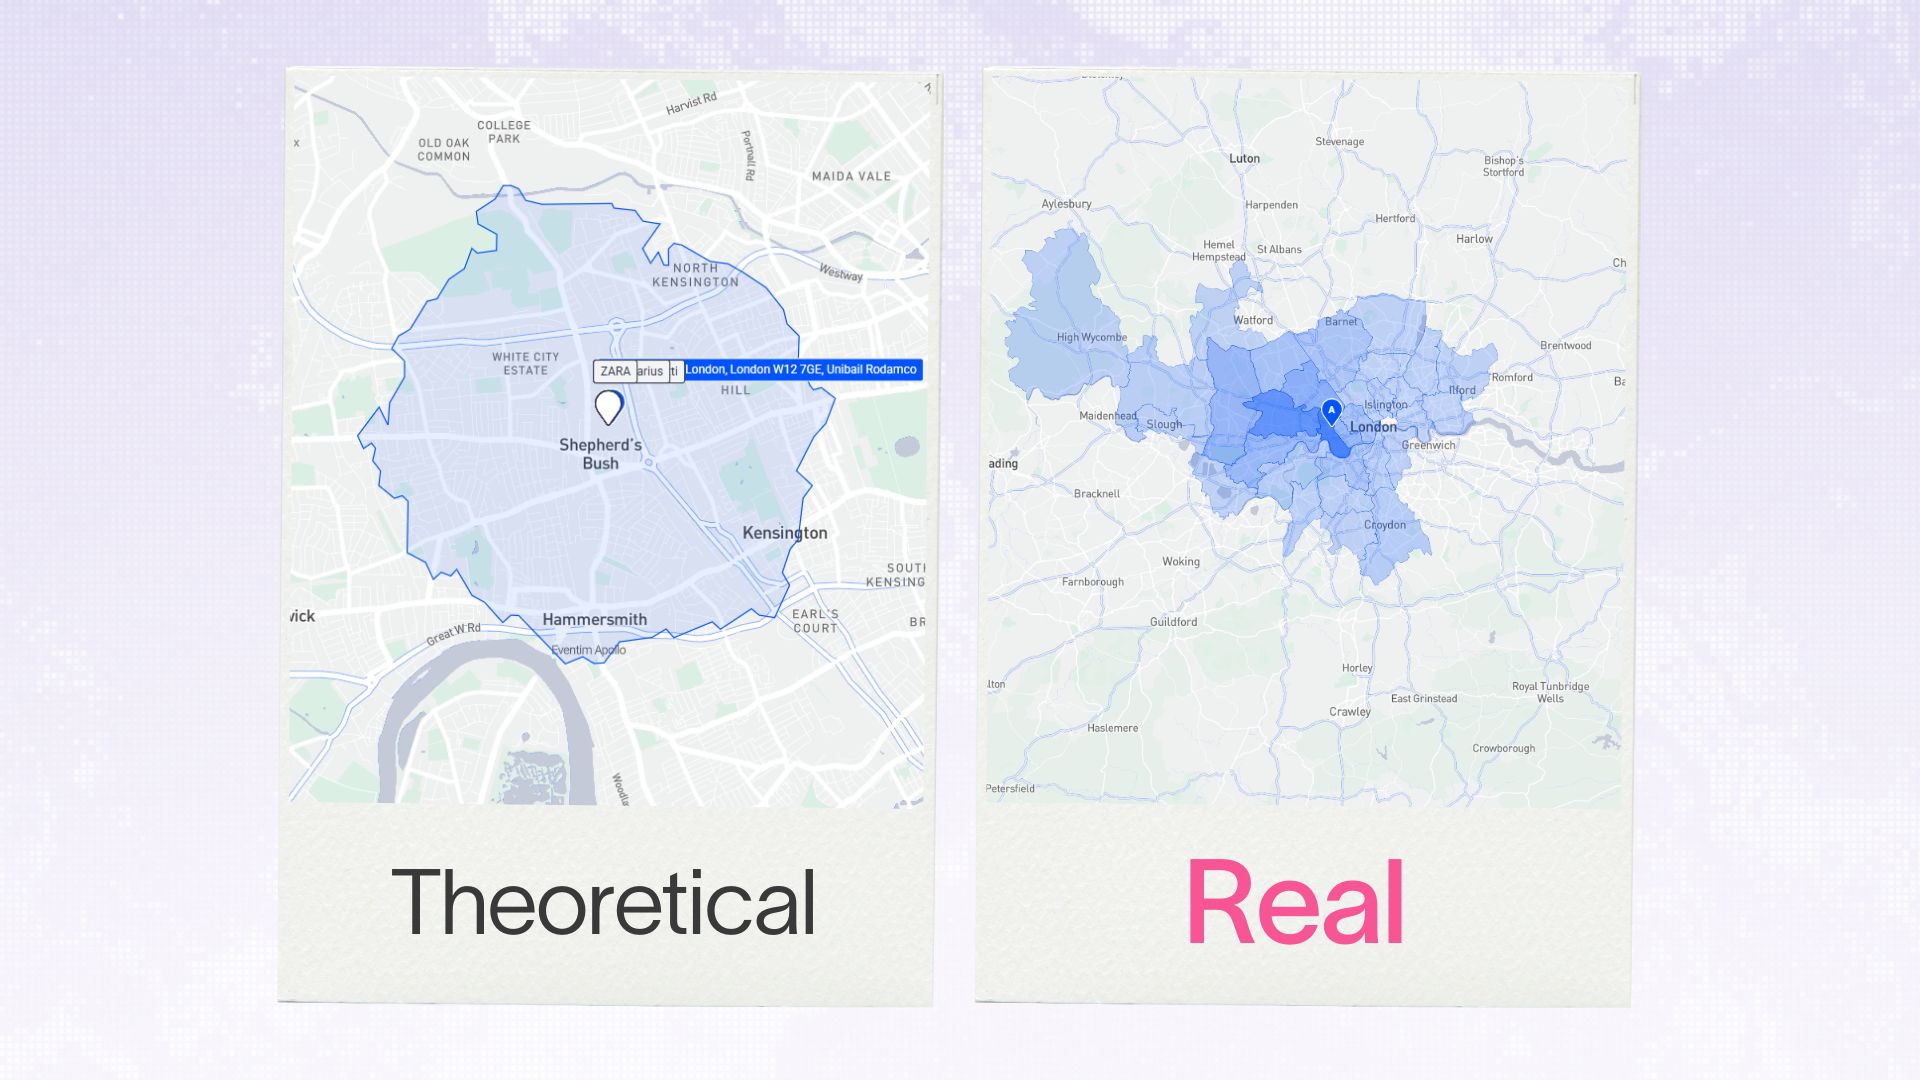
Census data tells you who lives within a radius. Foot traffic data tells you who actually shows up, and that gap is where most bad site decisions are made.
Five things it reveals that no other data source can match:
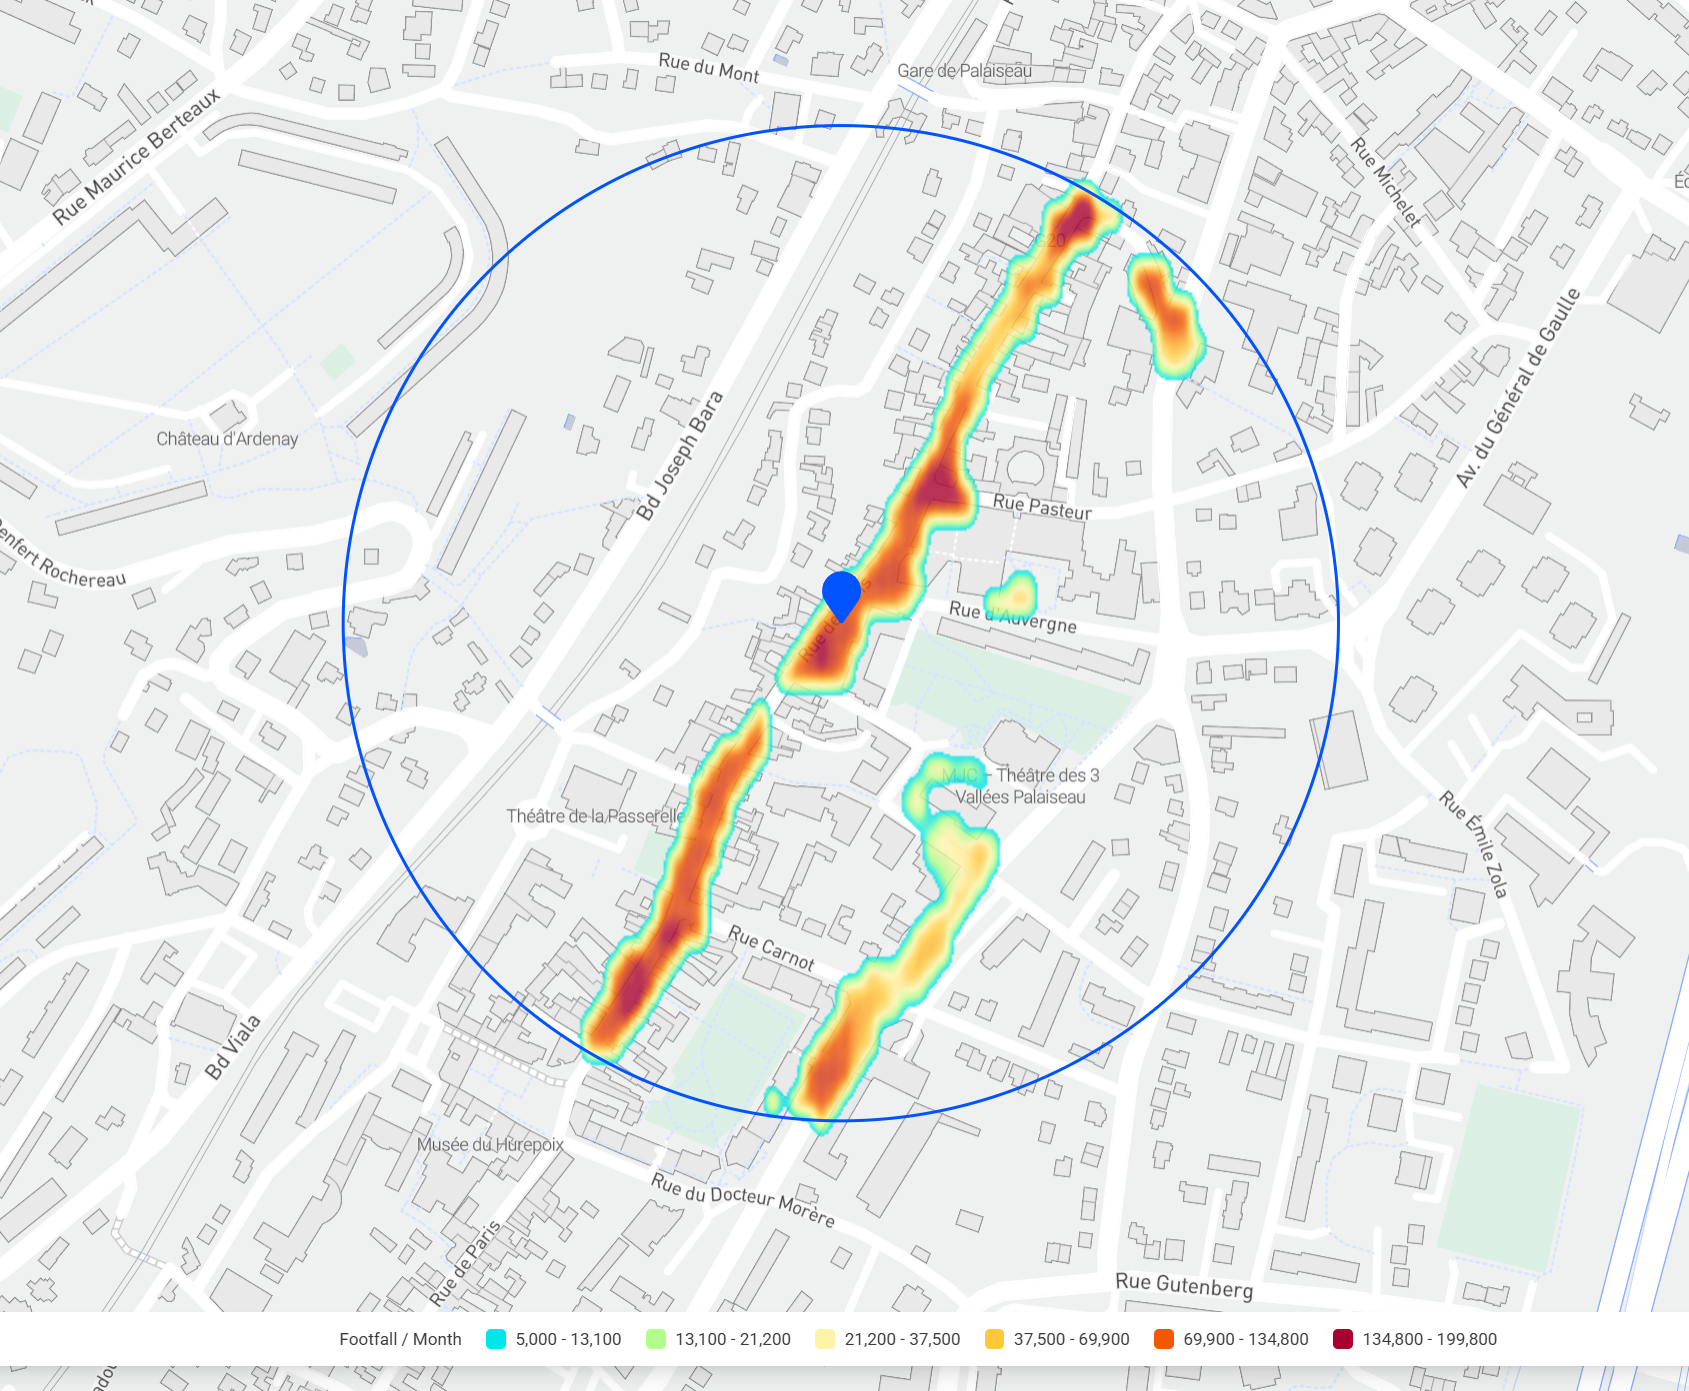
Actual trade areas, not radius assumptions. The standard 3-mile or 5-mile ring around a candidate site is a fiction. People don't shop in circles. Foot traffic data maps where visitors actually come from by home census block group, by drive time, by neighborhood, and the real trade area often looks nothing like the circle. The picture below is a great example of this.
Dwell time as a signal for fit. A site with strong foot traffic but 7-minute average visits is a different proposition than one with half the volume and 22-minute average stays. Short dwell time usually means pass-through traffic, people moving through rather than stopping. Long dwell time signals a destination environment, where visitors are shopping, eating, and browsing. Whether that fits your format depends on your category. A QSR benefits from pass-through. A specialty retailer needs destination shoppers. Foot traffic data tells you which you're getting before you commit.
Cross-shopping patterns. Foot traffic data identifies which nearby retailers share your customer base. If 60% of visitors to a candidate site also visited a specific coffee chain in the same week, you've found your ideal co-tenancy anchor.
This is how the best retail real estate teams build their co-tenancy formulas, not from intuition about which brands "feel right" together, but from visit overlap data showing who your customers actually shop with.
Competitor performance benchmarking. You can analyze your competitors' existing locations (visit trends by week, trade area shapes, where their customers come from, how performance has tracked over the past 12 to 24 months) before you sign anything. A market where a competitor's visits have declined 18% year over year reads very differently than one where they're up 12%. This is not information you could get any other way.
Fine trend analysis. A location's current visit volume is only part of the picture. Foot traffic data lets you track how a specific site or market is evolving year over year, whether visits are accelerating, plateauing, or quietly declining. A candidate site in a neighborhood with 14% visit growth over two years is a different bet than one with flat traffic in the same zip code. This time-series view of location performance is one of the most underused inputs in site selection, and one of the most predictive.
How do leading US retailers use foot traffic data in site selection?
The data is the same for everyone with access. How you use it is the strategy.
1. Market whitespace mapping
Before a team evaluates a single property, the question is which markets to be in at all. Foot traffic data answers this at scale. High population density plus rising visit trends plus low retail concentration in your category equals an underserved market worth examining. High population density plus flat or declining visit trends plus three of your competitors already operating profitably means the market is spoken for.
This step alone eliminates markets before anyone spends analyst time on individual properties. For a chain running 10 to 15 site evaluations a year, cutting bad-market searches early is where the real efficiency gain sits.
2. Competitive benchmarking and co-tenancy analysis
Site committees used to debate which competitors were nearby based on a map and someone's memory. Now they analyze actual visit data: how many customers does the nearest competitor pull, where do those customers come from, and do they overlap with the brand's target audience?
A site surrounded by the right neighbors, retailers with demonstrated customer overlap, consistently outperforms a technically superior location with the wrong co-tenancy. This is not a theory. Retailers who have built co-tenancy formulas from visit overlap data and applied them systematically to site scoring have measurably stronger opening performance than those who use proximity alone.
3. Cannibalization risk modeling
For any multi-location retailer, every new store carries cannibalization risk, the possibility that the new location pulls existing customers away from a current store rather than capturing genuinely new demand. When cannibalization is severe, a store that looks like growth on paper is actually just redistributing revenue.
Foot traffic data makes this quantifiable before the lease is signed. By mapping the trade area of the proposed site and overlapping it with the trade areas of existing locations, real estate teams can estimate the percentage of projected new-store revenue that represents transferred demand. If trade area overlap exceeds 30 to 40%, that's a material cannibalization risk that needs to factor into the pro forma.
The alternative, discovering this after month three of trading, is a common and expensive surprise.
4. Analog store analysis
The strongest predictor of a new location's performance is how existing locations with similar trade area profiles have performed. Foot traffic data lets retailers build a library of analog stores, current locations that serve as benchmarks, and identify candidate sites where the trade area characteristics match the analogs that have historically performed best.
This turns site scoring from a judgment call into a pattern-matching exercise. A candidate site whose trade area profile closely matches your top-quartile performers is a fundamentally different risk than one that matches your bottom quartile, even if both locations feel "good" on a drive-by.
5. Post-opening performance tracking
Site selection does not end at lease signing. Foot traffic data gives real estate teams the ability to monitor ramp-up curves, track whether cannibalization is materializing, and catch early signals of underperformance, often weeks before quarterly sales data arrives.
This closes the feedback loop that makes the next decision better than the last. Teams that track their openings against pre-signing projections systematically improve their models. Teams that don't are running the same gut-check process year after year, getting surprised in the same ways.
How do you calculate cannibalization risk before opening a new store?
Cannibalization is the most feared risk in retail expansion and the most under-modeled one. Here's how to quantify it.
The starting point is trade area overlap. Map the trade area of the proposed new site using visit data, not a radius, but the actual geographic distribution of people who visit comparable sites nearby. Then map the trade areas of your existing stores in the same region. Calculate the percentage of the new site's projected trade area that falls within an existing store's trade area.
When overlap crosses 20%, risk becomes meaningful. At 25%, retail site selection practitioners treat it as a standard reference threshold for modeling sales transfer. Above 30%, you're likely redistributing existing revenue rather than generating net-new growth. The exact transfer rate varies by category and store format, but a conservative model assumes that 50 to 70% of overlapping trade area customers represent transferred demand rather than incremental revenue.
That does not automatically kill the site. It changes how you evaluate it.
There's a counterintuitive case for strategic cannibalization: if a competitor is actively scouting the same market, accepting some self-cannibalization to occupy a location before they do can be the right call. A store that transfers 15% of an existing location's revenue while blocking a competitor from entering the market is a net positive for the network, if you've modeled it honestly. The risk is making that choice by accident rather than by design. Foot traffic data is what converts this from a guess into a decision with quantified trade-offs.
With Gini by Mytraffic, you don't need to build this model yourself. Ask it: "What's my cannibalization rate between this location and the rest of my network?" and it reads the place DNA of every relevant site, maps the trade area overlaps, and gives you the answer.
What is the real ROI of data-driven site selection?
The business case runs in three directions, and all three compound.
The right location breaks even faster.
A site with strong foot traffic alignment and well-matched co-tenancy reaches its revenue target faster than one that is structurally fighting its environment.
Ramp-up periods in retail, the months between opening and reaching steady-state performance, are expensive. They consume working capital, distort comparable sales metrics, and tie up management attention. Cutting the ramp-up period by two to three months on a single location, at average US retail rent levels, is a meaningful cash flow difference.
Good locations compound across the network.
A store that opens above plan in year one earns leverage at renewal, strengthens comparable sales growth, and makes the case for accelerating the expansion plan. A store that opens below plan does the opposite on every dimension.
Across a portfolio of 20, 50, or 200 stores, the difference between a selection process that consistently finds above-plan performers and one that produces 20% underperformers is a gap in network value that grows year over year.
The math is asymmetric.
With average US retail asking rents at $34.47 per square foot (Colliers, Q4 2024) and average lease terms now at 96 months (CBRE, 2024), a 3,000 sq ft location commits you to over $1M in rent before fit-out costs. Location intelligence access costs a fraction of that.
If it prevents one underperforming site decision per year, not even a failed one, just a meaningfully below-plan one, it pays for itself. The downside of not having the data is one bad lease. The downside of having it and not using it well is recoverable. The math only runs one way.
What does the next generation of retail site selection look like?
The shift that's already happening among the most aggressive retail expanders is not more data. It's AI that synthesizes location signals, trade area profiles, competitive dynamics, and network context into site scores that real estate teams can act on in hours, not weeks.
The traditional process (an analyst pulling data from multiple sources, building a model in a spreadsheet, presenting findings to a committee two weeks later) is not fast enough for a market where landlords are locking in leases three years early and the best locations go to whoever moves first.
Gini by MyTraffic is built for this. It reads the DNA of any location and turns that into a clear recommendation your team can act on. Not a dashboard to interpret. An answer.
Retailers who build this capability now will evaluate more sites, make fewer mistakes, and move faster than competitors still running the same instinct-and-census-data process they used a decade ago.
Frequently asked questions
What data do US retailers use to evaluate new store locations?
The strongest site selection processes combine foot traffic data (visit counts, trade area mapping, dwell time, cross-shopping patterns), competitive benchmarking (visit trends at nearby competitor locations), demographic data from census sources, and internal analog store performance data. Foot traffic data is the most differentiated input because it reflects actual consumer behavior rather than modeled estimates.
How do large retail chains avoid opening stores in the wrong place?
The most consistent approach is analog store analysis: identifying existing locations with strong performance, profiling their trade areas using visit data, and then scoring candidate sites by how closely their trade area characteristics match those analogs. This turns site selection from a judgment call into a data-matched decision. Cannibalization risk modeling, using trade area overlap analysis, is the second method that separates disciplined expanders from reactive ones.
What is cannibalization risk in retail expansion?
Cannibalization risk is the possibility that a new store will draw customers away from an existing store in your network rather than capturing new demand. It becomes material when the trade areas of the two locations overlap significantly. Foot traffic data lets retailers model this overlap before signing a lease, so they can either rule out a site, adjust the pro forma to reflect realistic net-new revenue, or make a conscious choice to accept some cannibalization for a strategic reason (such as blocking a competitor).
What is a trade area in retail?
A trade area is the geographic area from which a store draws the majority of its customers. Unlike a simple radius drawn on a map, a data-derived trade area reflects actual visit patterns, where customers come from by home location, drive time, and neighborhood. Primary trade areas typically contain 55 to 70% of a store's customer base. Foot traffic data from mobile devices is now the standard method for calculating trade areas accurately, replacing older methods like license plate surveys and credit card zip code mapping.
How accurate is foot traffic data for site selection?
Accuracy depends on the data provider and methodology. The highest-quality providers aggregate anonymized mobile device signals across tens of millions of devices, apply statistical modeling to remove noise, and validate against known sources. For site selection purposes, foot traffic data is most reliable for relative comparison, understanding which of two candidate sites draws more visits, has a larger trade area, or shows stronger visit trend momentum, rather than as an absolute visit count. Used this way, it materially improves decision quality compared to census data or radius analysis alone.
To resume
Every store decision you make in the next 12 months will be locked in for eight years. The retailers who get this right aren't smarter. They ask better questions, faster.
Start your 14-day free trial of Gini by Mytraffic and run your first site analysis today. No setup. No analyst required. Just ask.
Gini by Mytraffic covers 10 million locations across 14 countries with 10-meter accuracy.