

.jpeg)

.jpg)

Follow us on
Forecasts are a new Gini by MyTraffic feature that builds a revenue forecasting model from your own store network, then predicts revenue, revenue per square metre, staff headcount, or any other metric you choose, at any address. In internal tests run across live client networks, it's landed at 9% MAPE (mean absolute percentage error), meaning the number it gives sits within roughly plus or minus 9% of what actually happens.
Retail and grocery teams have been running forecasting analyses for decades. What's changed is how fast a team can build and trust a model that uses them.
What Forecasts do
Forecasts takes your own network data (the locations you already run, and how each one performs) and trains a model on a specific metric you care about: revenue, revenue per square meter, staff required, or any other number sitting in your data. It crosses that with MyTraffic's location intelligence layer: footfall, catchment area demographics, peak footfall hours, competitor density, public transport access, among other signals to train a custom model for your use case.
You then get a clear number, with an explanation of the reasoning behind it: the weights each variable carried, and the error margin. It also accounts for cannibalisation against your own nearby stores rather than scoring the candidate sites in isolation.
How accurate is Gini's forecasting?
A 2025 MarketsandMarkets analysis puts traditional forecasting methods at 20% to 35% MAPE, and machine-learning approaches at 8% to 20%.
Gini's forecasts sits at the strong end of the machine-learning range, and at roughly a third of the error of the traditional approach. Gini is able to achieve this level of accuracy for revenue forecasting because footfall is one of the strongest predictors of future store performance: the more real behavioural data a model sees for a given catchment, the less it has to guess.
Keep in mind that accuracy is dependant on how much network data they feed in and how varied their existing locations and catchment areas are. A retailer with 60 stores across five formats gives the model more to learn from than one with six stores that all look alike, and the forecast reflects that difference.
How it works, step by step

- Open the forecasts: feature tab on the left, then Forecast, then New forecast.
- Pick your country: forecasts are available in all 18 Gini countries, including France, the UK, Spain and the US.
- Drop in your network data: your existing locations and how each one has performed.
- Let Gini clean and geocode it: Gini works out what each column and row means and places every location on the map. That step normally eats weeks of an analyst's time.
- Gini trains the model on the metric you chose, most often revenue or revenue per square metre.
The whole flow, from upload to a trained model, runs in about 10 minutes, and nobody on the team needs a data science background to do it. Once trained, the model is yours. It lives inside Gini and it's ready to run against any address you give it, as many times as you want, without a new setup each time.
Using your forecast in any Gini chat
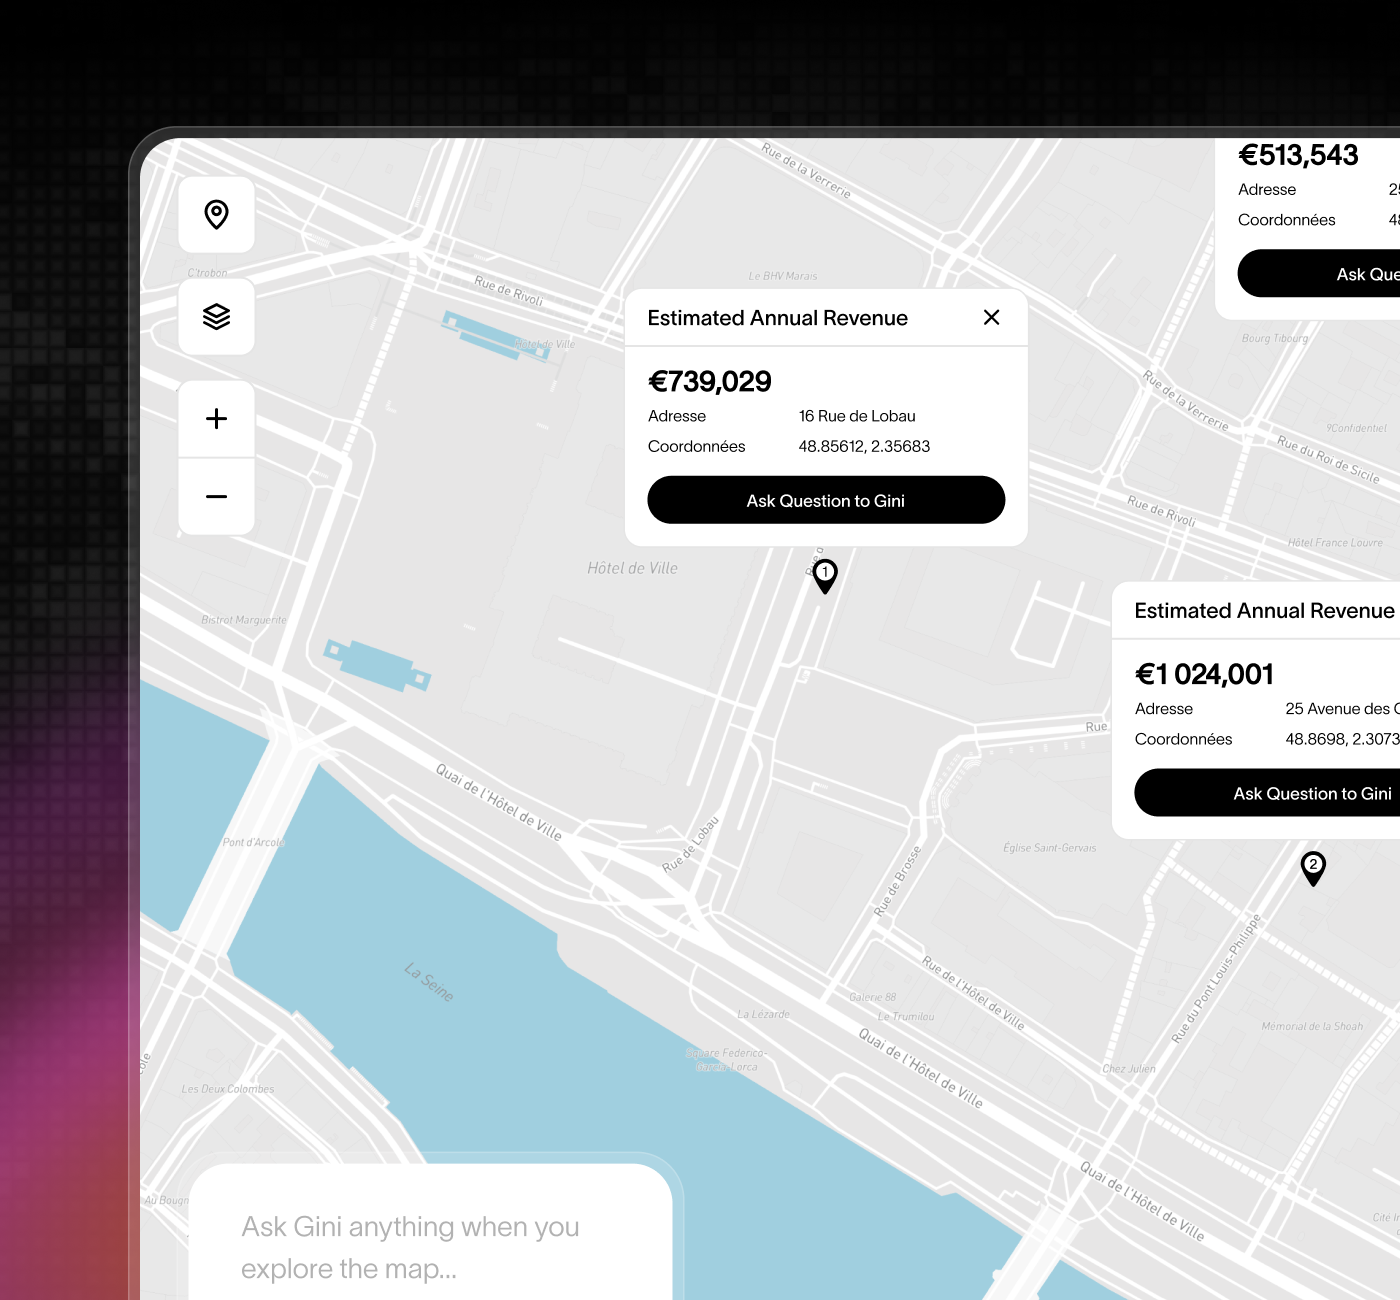
Once trained, the forecast lives in the same place as every other location question you'd ask Gini. Press @, pick your forecast model, type an address, and Gini returns the forecast, the reasoning behind it, and the error margin, in the same chat.
Say a grocery chain has trained a revenue-per-square-metre model on its 40 existing stores. A leasing team types in a candidate address on a high street in Lyon. Gini returns €4,200/m² with a confidence range of €3,700 to €4,700, and names the three inputs that pushed the number there: nearby residential density, morning footfall, and the absence of a direct competitor within 400 metres.
That's a number a finance committee can interrogate, not just sign off on. The same model can be reused across as many addresses as a team wants to test, at no extra setup cost per query, so comparing five candidate sites takes an afternoon instead of five separate consultant deliverables.
Why this changes the forecasting timeline
The old method looked like this: brief a consulting team, wait while they clean data, run checks, and measure accuracy. Then they deliver a model, then you start challenging it: does it match what we see irl? Which variables actually drove it? Can it be adjusted? Each round of questions is another round trip, and every round trip pushes the opening date, and the decisions, further out. Consultant-led engagements like Buxton's typically build a model over six to nine months, delivered once and revisited every few years if at all, before that iteration even starts.
Gini's forecasts removes the round trip. The person who knows the business trains the model, sees the error margin immediately, and can re-run it against a new address the same afternoon instead of the same quarter. What used to take a consulting engagement running from a few weeks at the low end to nine months for a fully custom build now runs inside a single Gini workflow, with no separate retail site selection software or vendor contract required.
Forecasts don't sit apart from the data behind choosing a flagship location in the first place; it's built on the same demographics, footfall and competitive density that go into that decision, just trained into a model instead of assembled by hand each time. What it removes is the months spent waiting for someone else to turn that data into a number, whether the site under review is a single flagship or one of several shopping centre candidates being screened at once as part of a wider multi-country retail expansion plan.
Frequently asked questions
How do you forecast revenue for a new store location?
Gini's forecasts trains a model on your own existing stores and their performance, then crosses that with location intelligence data such as footfall, catchment area demographics and competitor density to predict revenue, or another metric, at a new address.
What data do I need to build a forecast in Gini?
Your own network data: a list of locations and how each one performs on the metric you want to predict. Gini cleans, geocodes and structures it automatically once it's uploaded, and the full setup takes about 10 minutes.
How accurate are Gini's forecasts?
Internal tests have put it at 9% MAPE, but your personal mileage may vary. A 2025 MarketsandMarkets analysis puts machine-learning forecasting methods generally at 8% to 20% MAPE and traditional approaches at 20% to 35%, so Forecasts sit at the strong end of the machine-learning range.
Which metrics can Forecast mode predict?
Any metric present in your own data: revenue, revenue per square metre, staff headcount required, or a custom KPI specific to your business.
How is this different from an analog store model or a gravity model?
Analog and gravity models compare a candidate site to a handful of similar stores by hand, using distance and size as the main signals. Gini automates that comparison across your entire network, adds MyTraffic's location intelligence layer and cannibalisation checks against your own nearby stores, and shows the error margin rather than a single unqualified number.
TL;DR
Forecast mode turns your own store network data into a revenue forecasting model, trained in about 10 minutes with no technical skill required, and accurate to roughly 9% MAPE in internal tests across live client networks. Building that kind of model used to take a consulting team months. Forecast mode does it in one flow, from your own data.