

.jpg)
.jpeg)
.jpg)
.jpg)


Follow us on
A network manager benchmarking 40 stores against three national chains needs extremely precise data, and that's where specialized tools come in. Buy the wrong one and you'll have a dataset you can't make decisions with. Buy the right one and you're on your way to a promotion.
Here is a straight ranking of the 7 tools that matter in 2026: what each one is good at and what it costs wherever a vendor or a named third party publishes a number.
How to choose the right retail benchmarking tool
Here are the questions you should ask yourself before evaluating the follow tools.
- What is your objective? Take two retailers. One runs 40 grocery stores across France and Spain and wants to know how each compares to the nearest Carrefour or Mercadona on footfall and catchment overlap, which is a named-rival comparison. The other is deciding whether a market it has never traded in can support four stores or seven, which is a category and whitespace question. Those are different products, and a tool that is excellent at one can also be smediocre at the other.
- Does it measure every market the same way? A tool that reads footfall from mobile GPS data in France and estimates it from a device panel in Germany hands you two numbers that can'tbe compared, and a benchmark built on incomparable isn't a benchmark.
- Do you get an answer, or a dataset? Some platforms hand over a dashboard and leave the interpretation to your team, while others structure the comparison into a recommendation you can act on the same day. Neither is better in the absolute sense, but the answer changes depending on how much staff you have, and how quickly you need to act.
On the ordering: the tools that can benchmark a network across several European countries on one method come first, and the single-country specialists come last. That is a statement about breadth, not quality. Inside its own footprint, a specialist can beat a multi-country platform, which is why these tools make the list.
1. Gini by MyTraffic

Gini by MyTraffic sits first for one reason: it is the only tool here that combines named-competitor benchmarking across Europe with plain-language answers in the same conversation, rather than handing you a dashboard to figure out. Ask Gini how a Lyon store compares to the nearest Decathlon or Zara, and it'll automatically check footfall, catchment overlap, market share, socio-demo data and then give you a straight forward answeer.
The data underneath is anonymised GPS mobility data with a 10-meter precision, and MyTraffic reports coverage across 18 countries, 17 of them in Europe plus the United States, on onesingle methodology. That consistency is what makes a competitor comparison trustworthy in the first place: two numbers from two different methods aren't a benchmark. Gini goes further than just retail benchmarking: you can use it to compare any location against your best performing locations, forecast revenue, create an detailled expansion strategy, and much, much more.
My favorite part of Gini is that each insight has an explanation of what it means, how it's calculated, and how to interpret it. For retail and real estate teams that matters more than it used to, because decision committees need numbers they can contest.
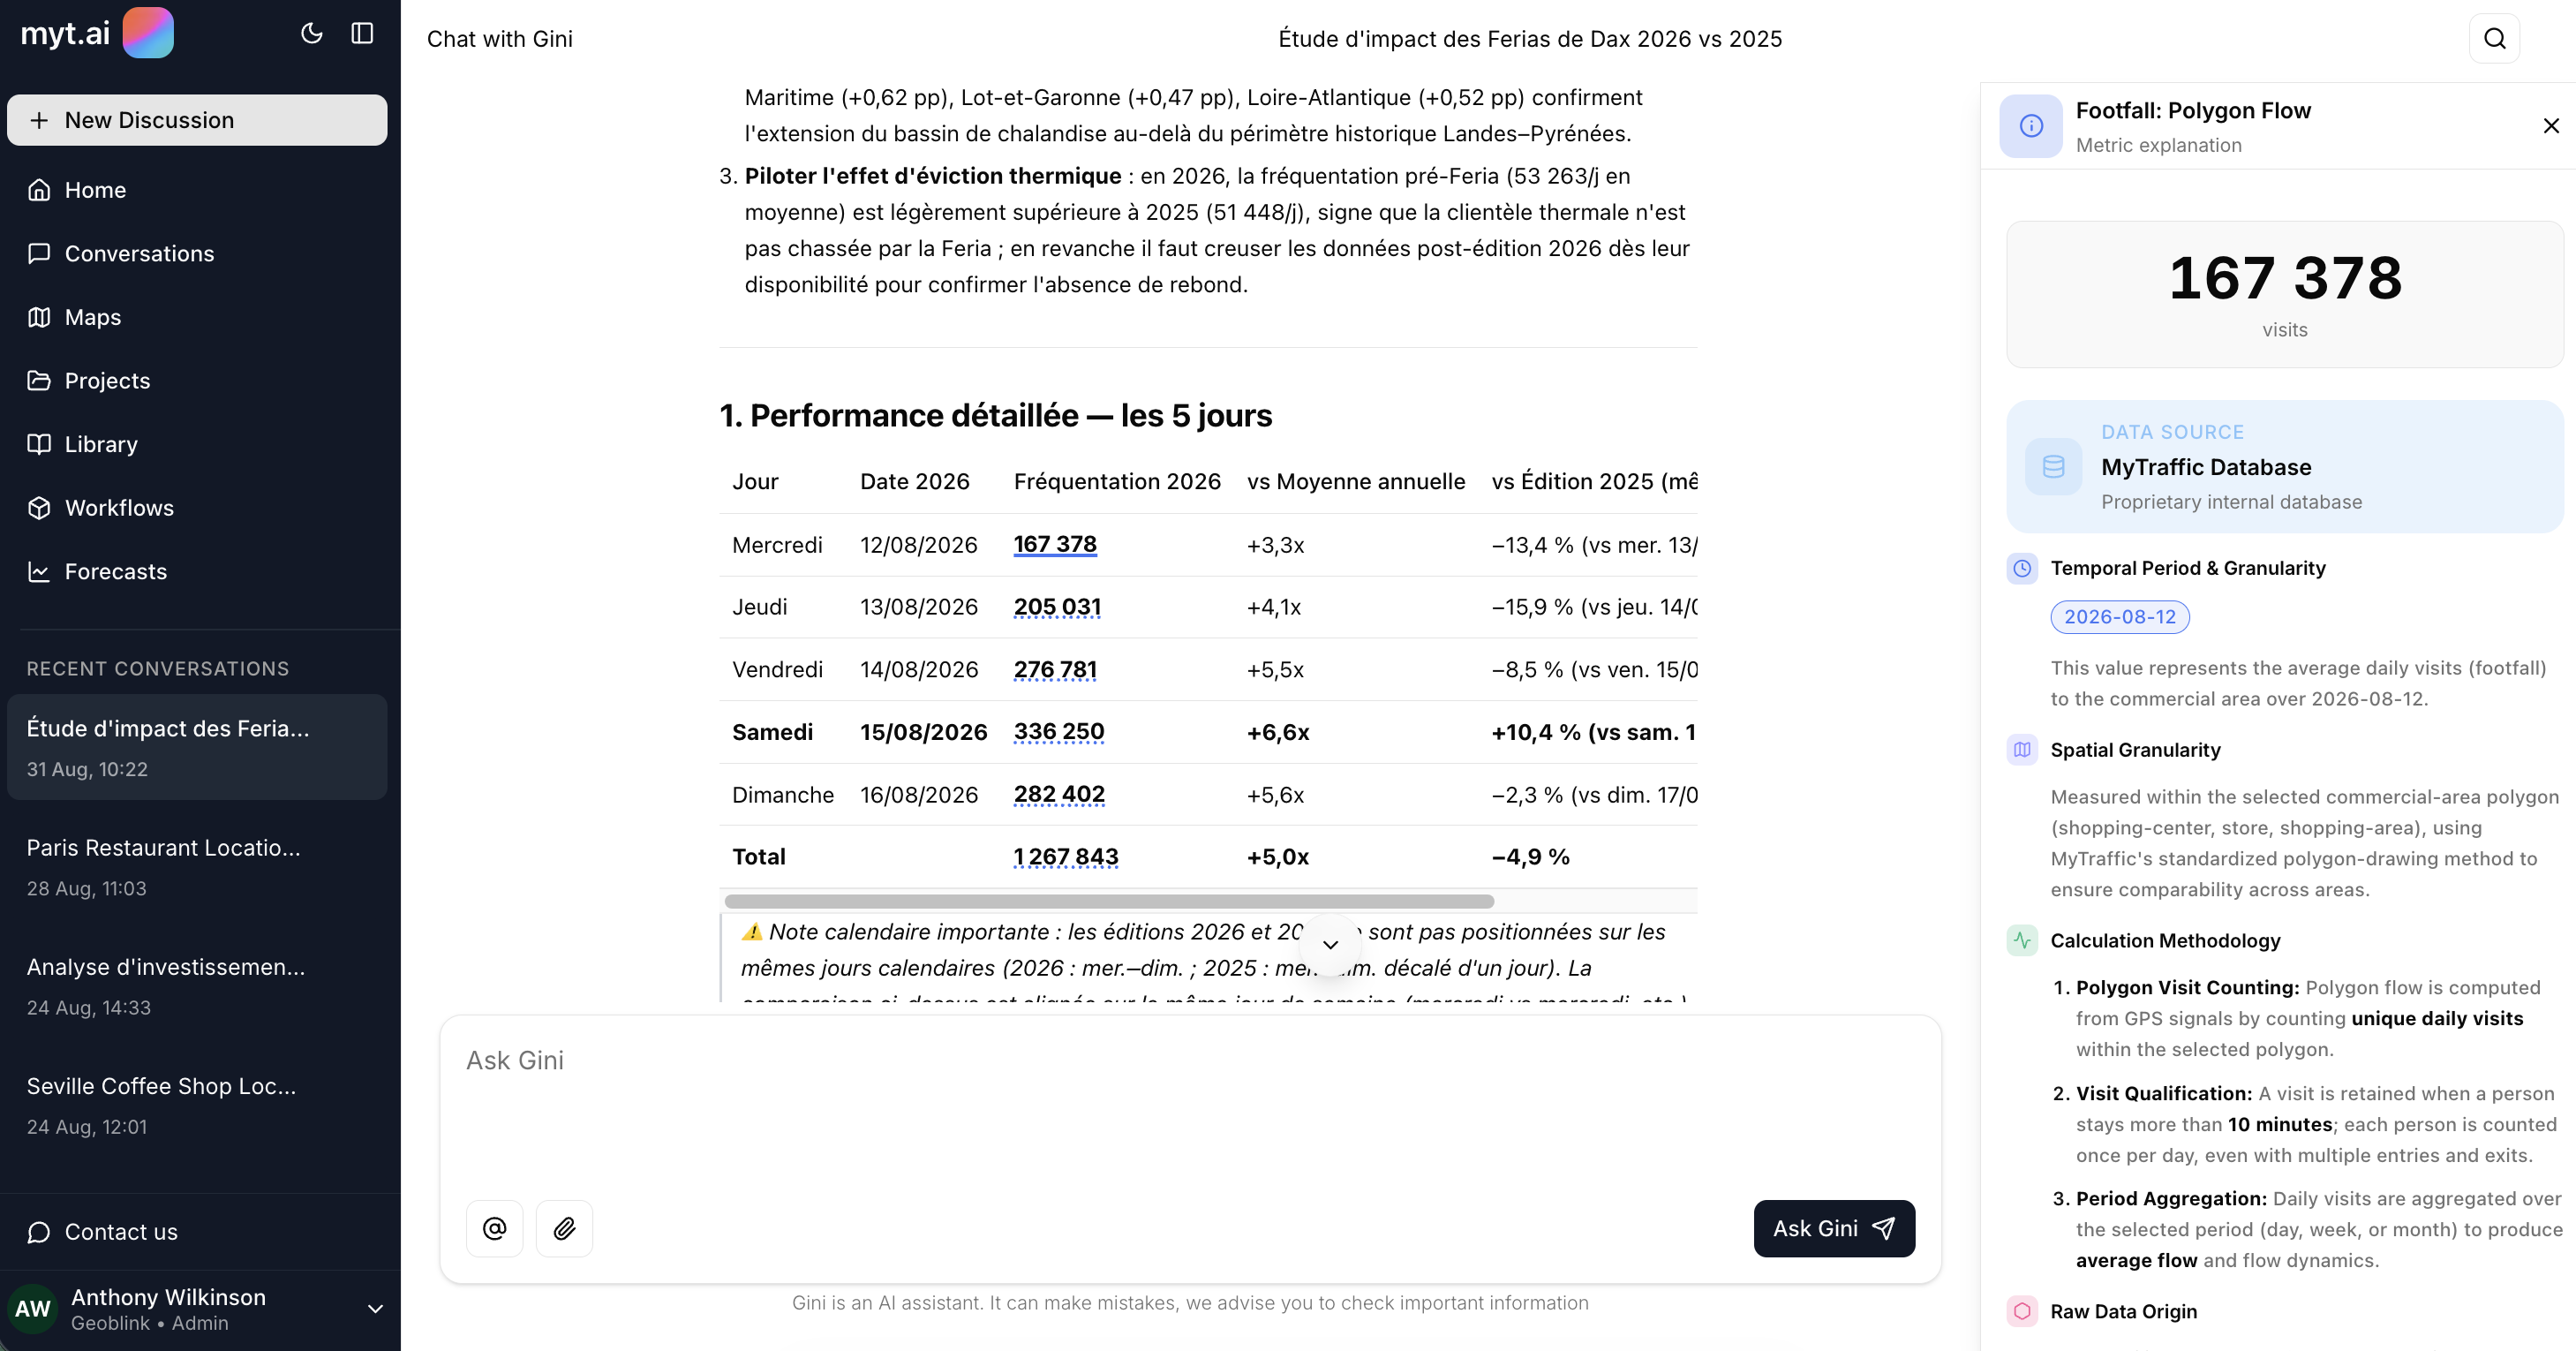
The entry plan starts at 249 euros a month, with a free trial, and the multi-country plan is priced on request.
Gini is the best for chain network managers and marketing managers who are benchmarking store or catchment performance against named competitors across European markets.
Gini reads the market outside your walls, but if your store is on the smaller end, the 10 meter precision will be too large to track what happens per aisle. This is a downside that all other tools on this list also share.
2. Dataplace.ai

Dataplace.ai treats benchmarking as one part of a wider site score rather than as a standalone comparison, and it covers the full European Union and the UK. For a single address it combines traffic volume, dwell time and the split between residents and passers-by with socio-demographic data such as age, income and professional status.
That combination answers a sharper question than raw footfall counts, which is whose traffic is worth more. A store pulling half the footfall of a rival, but sitting in a wealthier catchment, can still be the stronger location once spend potential is factored in. Dataplace.ai is built to surface exactly that comparison, and what it returns is a score you interpret rather than a recommendation you act on. It is also one of the few vendors here to publish pricing for its main product rather than routing every enquiry through sales.
Best for: Teams that want demographic and spend context layered onto a traffic benchmark across EU markets.
Where it stops: It is a site-scoring platform with benchmarking built in rather than a dedicated competitor tracker, so monitoring one named rival over time is not its core job.
3. Placer.ai

Placer.ai has the deepest benchmarking feature set on this list. Its competitive benchmarking and True Trade Area analysis cover visit trends, cross-shopping between named competitors and chain-level market share, all in one dashboard built for analysts who already know how to read one. You get a dataset and the tools to interrogate it, which is good if you have someone dedicated to this task.
Placer.ai's has great data depth, but it's dataset is both limited to the US, and some users have reported lower accuracy in smaller towns.
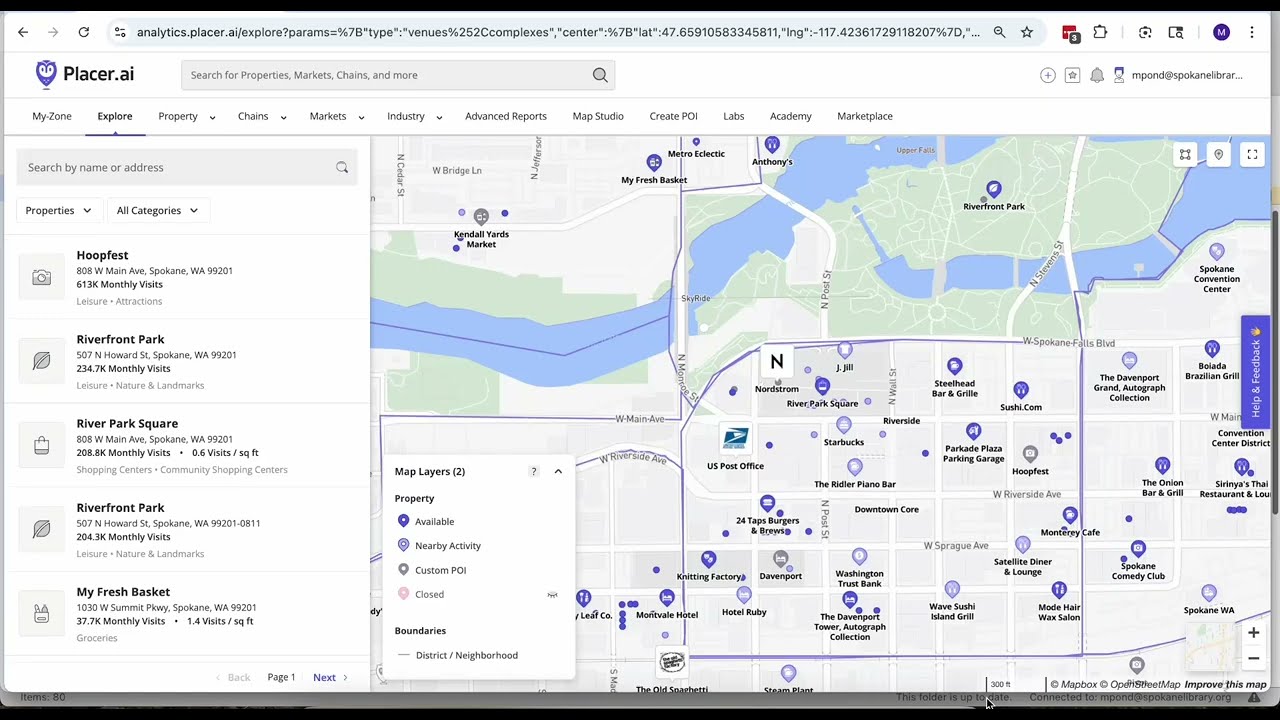
Best for: US-anchored retail chains benchmarking foot traffic and trade area against named competitors, with an analyst on hand to interpret the output.
Where it stops: European depth and price transparency, both of which are handled better by tools built natively for the region.
4. Unacast
.jpg)
Unacast sells location data rather than a benchmarking product, and it belongs on this list because a benchmark built from its feeds can go further than anything a packaged platform will give you. Its cross-visitation data shows where your customers go before and after visiting you, which is how you find out who your competitors are, and its site performance products measure a rival's share of foot traffic in a shared catchment.
Coverage is the widest here. Unacast says its aggregated visitation products reach more than 80 countries, with depth varying by market, which is a caveat worth taking seriously.
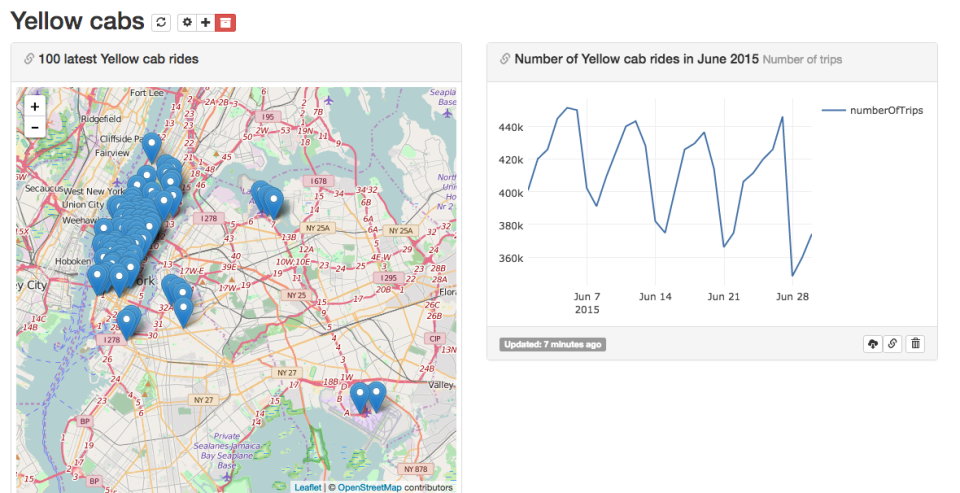
The catch is delivery. Unacast's self-serve insights platform is scoped to US locations, and outside the US you are taking licensed feeds through an API and building the comparison yourself. That is a dataset in the purest sense on this list, so budget for the data function that turns it into a benchmark.
Best for: Retail and real estate teams with an in-house data function that want to build cross-visitation and trade area benchmarks to their own specification.
Where it stops: Everything between the raw feed and the answer, which is the part you are paying an internal team to do.
5. Kalibrate
.jpg)
Kalibrate answers a question the other six treat as secondary, which is what a planned change will do to the network you already have. Its retail site selection products combine internal and third-party data to forecast sales, map trade areas, assess competitive intensity and model cannibalisation, so the benchmark it produces is forward-looking rather than a picture of last quarter.
The competitive modelling is more specific than most. Kalibrate distinguishes between competitors that are "impacting", meaning both of you sit within five minutes of the same consumers, and competitors that are "intercepting", meaning a shopper has to drive past their door to reach yours. That is a distinction most footfall platforms cannot draw, and it changes what you do about a rival opening nearby.
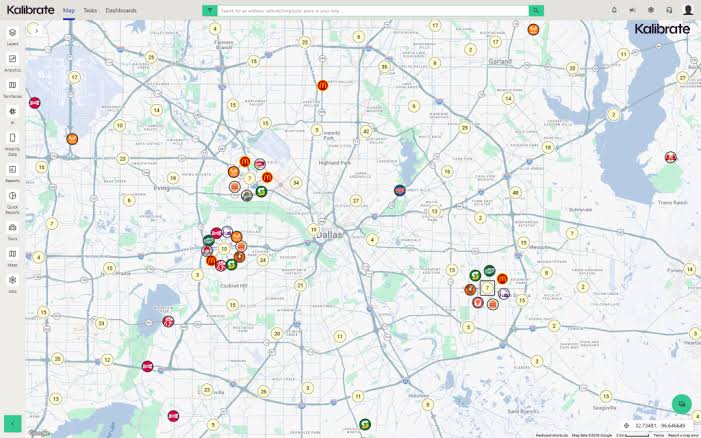
The tradeoff is weight. Kalibrate is an enterprise engagement with analysts attached rather than a tool you log into on a Tuesday afternoon, its deepest specialism is fuel and convenience retail rather than high street or shopping centre formats, and pricing is quoted rather than published. You get an answer, but you get it as a modelled forecast at the end of a project.
Best for: Multi-site networks modelling the revenue and cannibalisation impact of an opening, a closure or a portfolio change before committing to it.
Where it stops: Fast self-serve comparisons, and formats outside its fuel and convenience heartland.
6. Roofstreet

The last two tools in this list do close to the same job in two different countries, so it is worth reading them as a pair rather than as consecutive rankings.
Roofstreet answers one question precisely: where a store's catchment sits once you measure it from where customers travel in from, rather than drawing it as a theoretical drive-time ring. The company says its retail platform analyses the movements of millions of smartphones to build catchment bands from observed mobility, which surfaces the barriers an isochrone map misses: a river with few crossings, a stretch of roadworks, a park that people walk around rather than through.
For a franchise network checking catchment overlap between two nearby units, that precision is exactly the input a cannibalisation check needs, and Roofstreet publishes a cannibalisation rate and alerts on competitor network changes rather than leaving both to be inferred from a map. The tradeoff is reach, because Roofstreet's depth sits in France and its Francophone neighbours, a network spanning Germany, Italy and Spain will find thinner coverage outside that footprint. Its site and platform documentation are in French, which is worth knowing if the team reading the output is not.
Best for: French and Benelux retail and franchise networks that need precise, mobility-based catchment area benchmarking rather than isochrone estimates.
Where it stops: Coverage outside France and its immediate neighbours.
7. Place Informatics

Place Informatics does one thing particularly well for UK retail and asset management teams, which is showing where visitors came from and how that catchment overlaps with a nearby competitor's. Its catchment product breaks visitor profiles down by postcode, identifies which competitors sit inside a catchment and how they affect performance, and separates local shoppers from tourists. The company says it collects GPS data points from more than 12 million phones and reports a confidence level of 95 to 99 percent on the resulting datasets.
Separating locals from tourists is what turns this from a footfall counter into a competitor benchmark. When a shopping centre wants to know which nearby rival is cannibalising its visitor base and which one draws from an entirely different catchment, this is built to answer that, though it answers it as a dashboard rather than as a recommendation.
Best for: UK shopping centres, high street retailers and asset managers benchmarking visitor origin and catchment overlap against named local competitors.
Where it stops: Its data foundation is UK-specific, so it is not the tool for a network benchmarking performance across several European countries at once.
Which one to buy first, and what to pair it with
Most teams cannot justify two licences in the same budget cycle, so the sequencing matters more than the shortlist.
Start with the broadest consistent method your footprint requires, not the deepest tool in your largest market. A French network that buys Roofstreet first will get great French answers, then hit a wall the moment it looks at Spain, and purchasing a second tool will produce numbers that cannot be compared with the first. Buying the pan-European platform first and adding a specialist later gives you a spine that every subsequent tool can be read against. Reverse the order and you are running two methodologies with no way to reconcile them.
The exception is a network with no cross-border ambition. If everything you will open in the next three years sits inside one country, the specialist is the better first purchase, and the pan-European licence is a cost you do not need yet.
On pairing, the combination that works for most European chains is one market-level platform covering every country you trade in, plus either a local specialist in the market where the decisions are densest or a data feed if you have the team to work it. Budget for analyst time alongside the licence, because a tool that returns a dataset rather than an answer costs you a person's week every month.
Before signing anything, ask each vendor what its benchmarks return for your specific locations. You'll be able to validate their data against yours : if there is too big of a gap, their data cannot be relied upon.
Frequently asked questions
What is a retail benchmarking tool?
A retail benchmarking tool compares your stores against a reference point you do not control, which is either a named competitor, a category average, or a market you have not entered. It measures the world outside your stores, using mobility, catchment and demographic data tied to specific addresses.
Are in-store people counters retail benchmarking tools?
No. Counters such as ShopperTrak, Springboard, Quantaflow and Pygmalios measure entries, queues, dwell and conversion inside your own stores, so they can compare your sites to each other but never to a competitor's. They are complementary to the tools on this list rather than alternatives to them.
How much do retail benchmarking tools cost?
Most vendors in this category quote rather than publish. Gini by MyTraffic lists an entry plan at 249 euros a month. Everything else on this list is priced on request.
Which retail benchmarking tool is best for a European network?
For a network trading in several European countries, the deciding factor is whether one consistent method covers all of them, because a benchmark assembled from two methodologies cannot be compared. Gini by MyTraffic covers 18 countries on a single method, Dataplace.ai covers the EU and UK, and Roofstreet and Place Informatics go deeper inside France and the UK respectively.