

.jpeg)

.jpg)
.jpg)

Follow us on
Stores reach buyers the website never gets. Welcome to our first edition of our US Retail Observatory, a series started by Pauline Paris on what American retail is doing now and what it signals for the broader market. In 2015, Warby Parker said that 30 to 50% of the people who buy in its shops were unlikely to have ordered online at all. Those customers were never in the funnel, so the store added a market instead of moving revenue between channels. That's why DTC brands opening physical stores now treat the store as their growth plan.
The question worth arguing about is where, because it's the one that costs most to get wrong. Warby Parker and FIGS pick addresses on customer density, foot traffic composition and purchasing power, and that method is the part you can copy for your brand.
Why DTC brands are opening physical stores
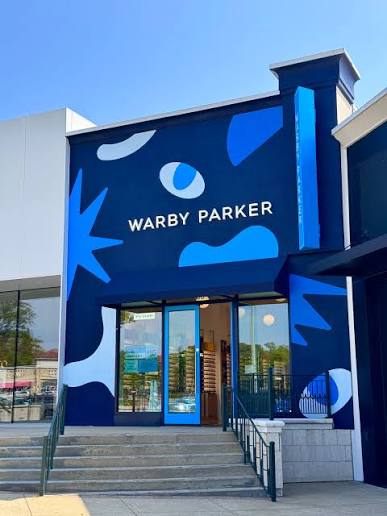
Warby Parker launched with a home try-on box and no shops at all, and ended 2025 with 323 retail stores across the United States and Canada. It opened 47 stores that year and plans around 50 more in 2026. The growth didn't come at the expense of profit: 2025 was also its first full year of net income. The same filing puts the US opportunity at more than 900 stores, based on research commissioned in 2021, so Warby Parker has opened about a third of what it thinks the market can hold.
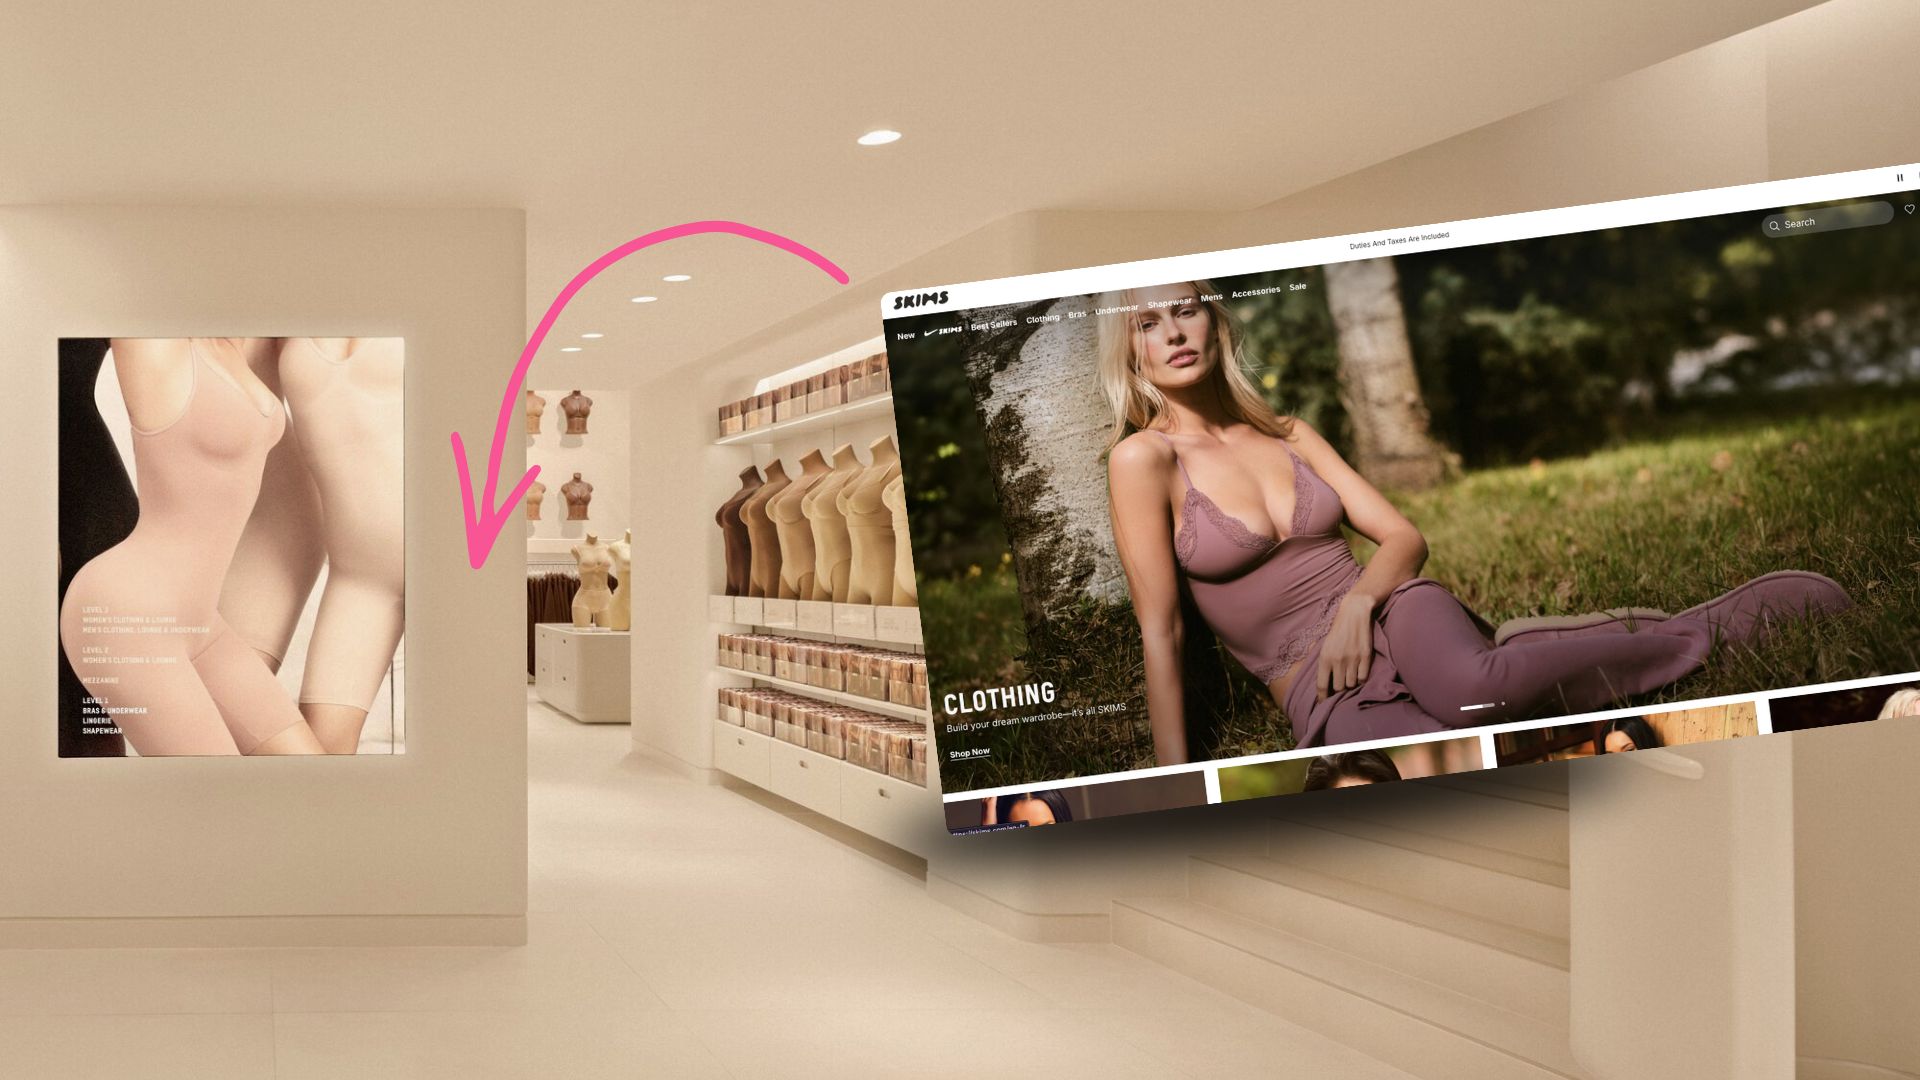
SKIMS had 18 owned US stores in November 2025 when it raised $225 million at a $5 billion valuation, led by Goldman Sachs Alternatives, to fund physical expansion, with the aim of becoming a predominantly physical business. Chief executive Jens Grede has told WWD that stores are probably the company's single biggest growth lever. Demand isn't what holds SKIMS back. Not having stores where people live is.
Vuori reached 100 owned stores with its Aspen opening in August 2025, ahead of the 100-by-2026 goal it had set itself, with Seoul and Beijing stores planned for that fall. Glossier went the wholesale route, adding Sephora's roughly 600 US and Canadian doors alongside its own shops. It's wholesale, not owned retail, but it's the same move off the screen and onto shop floors.
Money explains the timing. Paid acquisition got more expensive as more DTC brands bid for the same impressions, and Shopify's clicks-to-bricks analysis cites ProfitWell research putting B2C acquisition costs up about 60% over five years.
Rent is a number you sign up for and stays the same (most of the time). Ad auctions move daily, and are therefore unpredictable. This fact is another great reason for considering opening physical stores as a DTC brand.
Physical retail doesn't cannibalize digital, it recruits a different buyer
The old objection was that a store just moves an online order to the register. Warby Parker's 30 to 50% says otherwise, but it's a company's own figure from 2015, so it helps that independent data points the same way. ICSC's 2023 halo study tracked in-store and online spending by ZIP code for 69 retailers and 2,103 store openings and closings, and found that opening a store lifts online sales in the surrounding trade area by 6.9% on average, and by 13.9% for emerging DTC brands. If stores only moved orders between channels, online sales near a new store would fall, but as you can see, they rise.
Of course, the impact on your business will differ from benchmarks, so if you plan on doing a similar move, measure the impact.
How DTC brands choose store locations, step by step
Warby Parker has described the principle. In 2018, co-founder Dave Gilboa told Digiday that its site model weighs more than 100 variables, and the strongest predictor of a store's performance is how many existing customers live near the address.
FIGS shows what that looks like when the brand's customer is a profession. For its second store, the medical apparel brand chose Rittenhouse Square in Philadelphia, a city with the fourth-highest number of healthcare professionals in the country, within 2 miles of five healthcare institutions. FIGS didn't pick a good retail street and hope its customers turned up. It found where they already were, then found a street.
Here's the sequence behind decisions like these.
Step 1. Map your own customer density before you look at a single unit
Your online customers aren't the store's whole market, but they're the best map of it. Where they cluster, the people who look like them and have never ordered live too, and those are the buyers the store exists to reach.
Plot your existing customers by ZIP code, find the clusters, and size each one in annual spend. 4,500 customers inside a 10-minute catchment who order 1.5 times a year at $120 is about $810,000 of online spend a year within reach of the door. No store captures all of it, but it tells you the demand is there before you open.
Where your own data is thin, which for many brands means everywhere outside two or three cities, use the population that looks like your buyer. FIGS used healthcare employment. A coffee subscription brand might use office density, and a childrenswear brand households with young children or school density.
You can use tools like Gini by MyTraffic to make this step much easier: either give it your existing customer data or explain your concept, and the tool will identify the highest potential areas for your brand.
Step 2. Draw the catchment by travel time, not by a circle
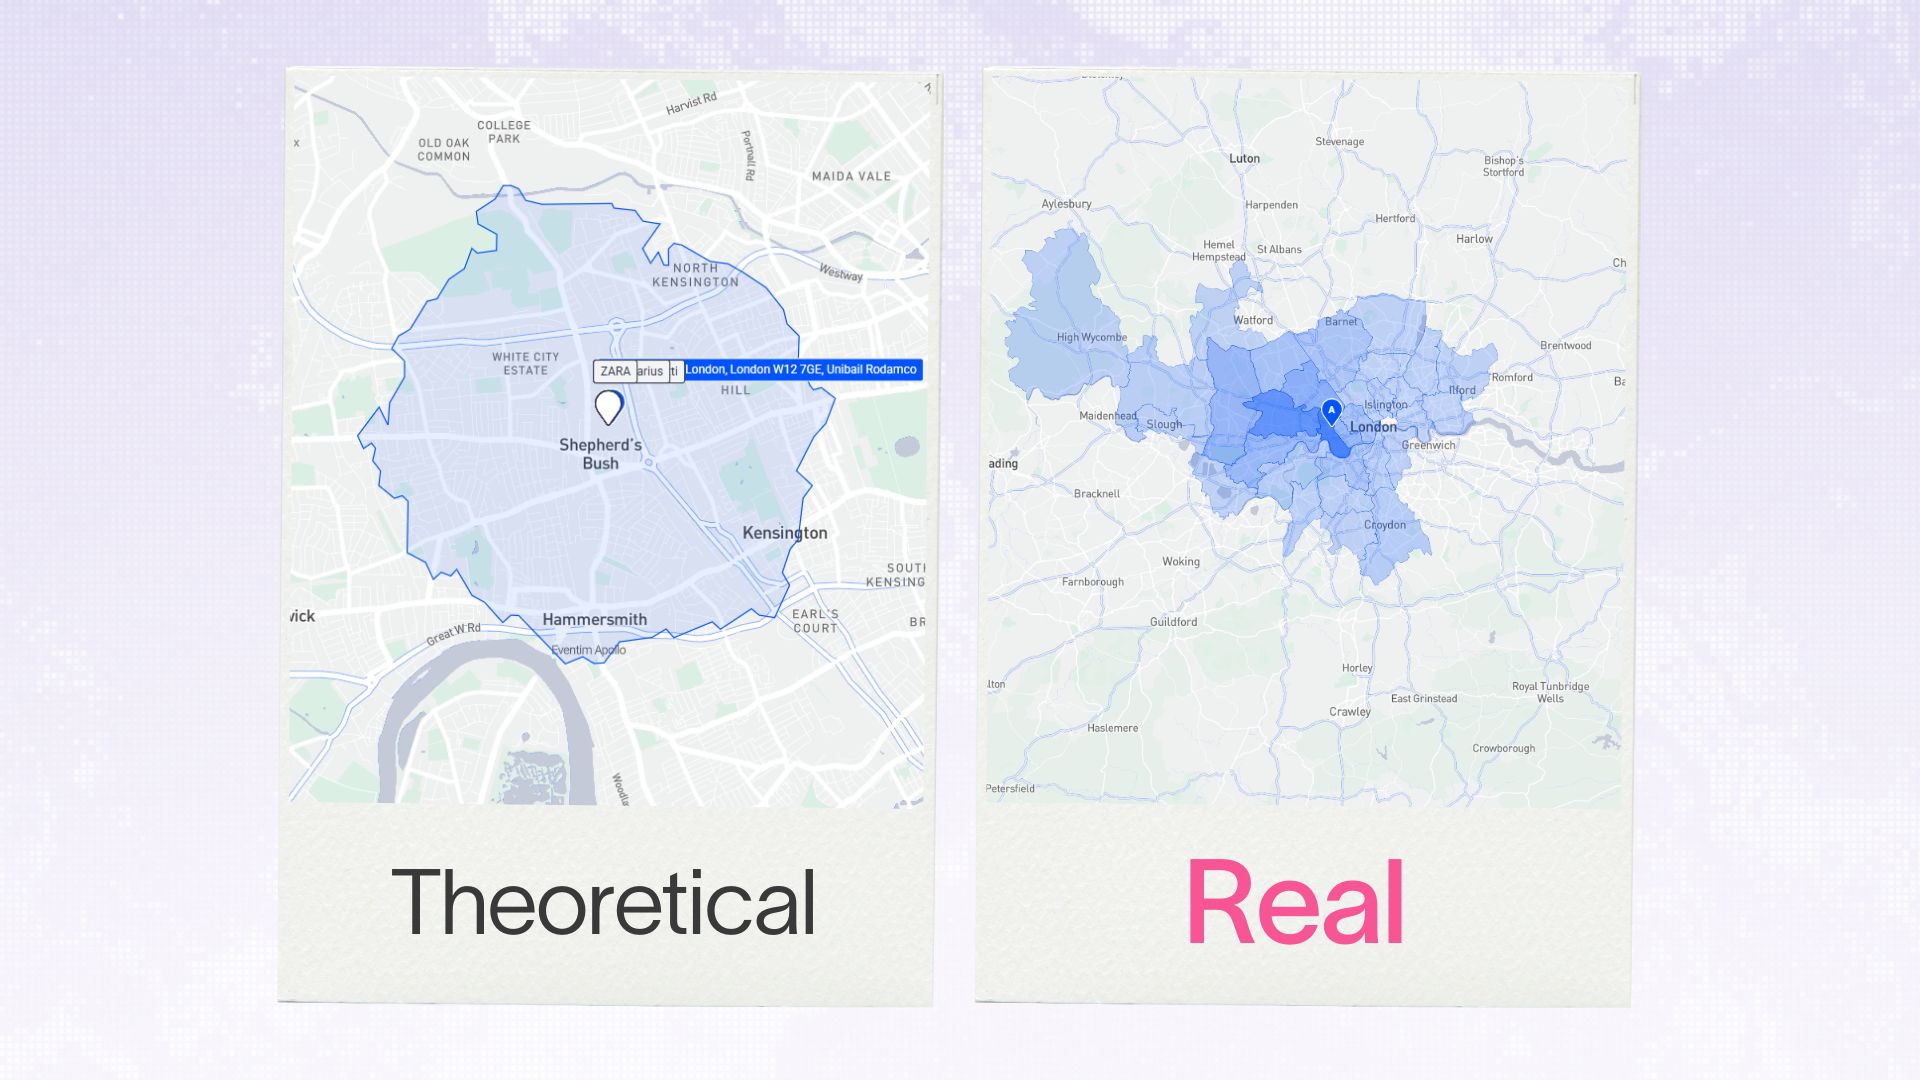
For this step, use isochrones, and fix one band per format before you compare anything: 10 minutes on foot for a dense urban unit, 15 minutes by car for anything suburban. Mixing bands across a shortlist is the quickest way to talk yourself into the wrong site, since a drive-time catchment always looks bigger than a walking one.
Inside that boundary, three figures describe the market: resident population, daytime working population, and median purchasing power indexed against the national average. If you can get more precise data, try to find how much of the resident population is within your addressable market. For example, for the childrenswear brand, if there are 1500 households with children in a 6000 household catchment, then 25% of the market is addressable.
Step 3. Read the foot traffic, then read who the foot traffic is
A street with 45,000 weekly passersby only beats one with 18,000 if enough of those 45,000 are your buyer, and on tourist-heavy shopping streets that share is often low. What you want is foot traffic broken down by origin, frequency and profile: residents versus visitors, how many come back weekly, what they spend. Modern location intelligence tools break foot traffic down this way by address and by hour, so you can tell a lunchtime office peak from a Saturday tourist flow. Lunchtime peak? This location is great for a salad bar. Saturday peak? Perfect for a fashion store.
Frequency is the part shortlists tend to skip. A commuter who passes four times a week is worth several tourists who pass once, because a considered purchase rarely converts on first exposure.
Step 4. Read the competition and the co-tenancy
Competition can help or hurt, depending on your category. For low-frequency, high-consideration purchases, neighboring brands with the same customer can create a destination and lift you. For everyday repeat purchases, a direct competitor a block away mostly splits the catchment.
Co-tenancy usually says more, because the anchor tenants show which customer the street already pulls. An athleisure brand next to a boutique fitness studio and a premium grocer is reading the same customer three times over. If you already trade from a few stores, the factors that already make those stores work are the ones to look for in that mix. If you don't, use the co-tenants around your best pop-up or wholesale doors.
Step 5. Price the site against what the catchment can actually spend
Build the revenue estimate yourself, not from the landlord's pitch. Take the unique population inside the isochrone, apply a capture rate, apply your average basket, then set occupancy cost plus amortized fit-out against the result. CRE analysts generally treat occupancy cost of around 12 to 15% of sales as healthy for apparel tenants. This example uses 15% for occupancy and fit-out combined, which is a stricter test than occupancy alone.
The capture rate is where first-time openers get stuck, because they haven't achieved one yet. The fix is to buy one before you sign a lease. Warby Parker ran showrooms out of its own offices and signed its first long-term lease only once it had proof it could do several million dollars in sales. Sézane ran long-term pop-ups at The Grove and Brentwood Country Mart in Los Angeles before opening a permanent Brentwood boutique. A 3-to-6-month pop-up in your strongest cluster gives you a real capture rate, plus the online penetration of the catchment it came from.
Then scale that capture rate to each candidate site by the same ratio. A catchment where twice as many people already buy from you online should convert roughly twice as well, and one where half as many do, roughly half as well. Treat that as a starting point you refine store by store, not a law.
For example: take a US brand choosing its first permanent store outside its home city, with a $120 average basket size. Its pop-up, annualized, captured 8% of the unique people in its catchment, where 4% already bought online. Both candidate sites are dense urban units, so both use a 10-minute walking catchment.
Site A is on a major downtown street: 45,000 weekly passersby, mostly visitors, and a catchment of 200,000 unique people (40,000 residents and 160,000 workers who live elsewhere). Its purchasing power index is 96, and 4,000 existing online customers make up 2% of the catchment. Occupancy cost is $210,000 a year, and a $450,000 fit-out amortized over a 10-year lease adds $45,000.
Site B is in a dense residential neighborhood 4 miles out: 18,000 weekly passersby, mostly residents who come back weekly, and a catchment of 90,000 unique people (80,000 residents and 10,000 workers). Its index is 128, and 4,500 existing online customers make up 5% of the catchment. Occupancy is $90,000, and a $300,000 fit-out over the same term adds $30,000.
At the pop-up's 8%, both pass. Site A returns 200,000 × 8% × $120, or $1.92 million, against $255,000 of occupancy and fit-out, which is 13.3%. Site B returns $864,000 against $120,000, or 13.9%. On those numbers both sites clear 15%, and Site A looks like the bigger prize.
Now scale the capture rate. Site A's online penetration is 2%, half the pop-up's 4%, so its capture drops to 4%. That's $960,000 of revenue, and $255,000 is 26.6% of it, which fails badly. Site B's penetration is 5%, a quarter above the pop-up's, so its capture rises to 10%. That's $1.08 million against $120,000, or 11.1%, which passes comfortably and beats Site A on revenue at less than half the cost.
The foot traffic and purchasing power figures don't enter the sum. They tell you whether the scaled rate is believable. Site A's visitor-heavy traffic and below-average index fit a lower capture, and Site B's repeat, resident traffic at index 128 fits a higher one. If they had pointed the other way, you'd distrust the scaling and go back to the data.
One more check before you sign. Site B's 9,000 store buyers a year include some of its 4,500 online customers, and their spend moved channel instead of growing. Even if every one of them shifted, at least 4,500 buyers, half the total, are people the website never reached. That's the Warby Parker range turning up in your own numbers, and your holdout test tells you where in it you actually sit.
So Site B is the opening and Site A is the second store, unless you're buying the street as a brand billboard and have budgeted it out of marketing, not retail. That's a legitimate choice, and the reasoning Gymshark gave for its first continental European store reads like one: on Amsterdam's Kalverstraat in 2025, founder Ben Francis pointed to the street's more than nine million visitors a year. Visibility at that scale is a marketing buy. Name which one you're making before you sign.
Digitally native brands in Europe face the same shift on different leases
The method travels, but the cost of a mistake changes with the lease, which matters if you're a European brand or a US brand crossing the Atlantic.
A French bail commercial runs a minimum of 9 years, and the tenant can normally leave at each 3-year mark, so the real minimum commitment is 3 years. What hurts on prime streets is the money paid before you trade: pas-de-porte to the landlord on a new lease, or droit au bail to the outgoing tenant when you take over theirs, and neither comes back if the site fails. France also has a bail dérogatoire of up to 3 years, which suits exactly the kind of test step 5 calls for. German commercial leases usually run 5 or 10 years, often with tenant options to extend. US terms are negotiated case by case, and a first-time tenant can ask for a kick-out clause that lets it leave if sales miss an agreed threshold.
That argues for better site selection, not for staying online. Market structure differs enough by country that the same brand needs a different answer in each one, and building the expansion plan on location data, instead of on a target store count, is what keeps a 9-year commitment defensible to a board.
Location is strategy, not execution
Stores came back because they reach people advertising can't, and because, as the halo data shows, a store in the right catchment grows the online business around it. The brands doing this well, Warby Parker and FIGS most visibly, treat site selection as analysis, not property hunting, and that's the part you can copy.
Map where your existing customers cluster, buy a capture rate with a pop-up, then work through the catchment, foot traffic, co-tenancy and pricing checks above before you sign for a single unit. The full data-driven checklist for choosing a location walks through each criterion in order.
Next in the US Retail Observatory: the American markets where these openings are concentrating!
TL;DR
DTC brands are opening stores because physical retail reaches buyers the website never converts. The ones getting it right test with a pop-up first, then pick sites by mapping their own customer density, travel-time catchment and foot traffic composition before they sign anything.