

.jpg)
.jpeg)


.jpg)

Follow us on
A new store has no sales history. That's the whole problem forecasting tries to solve. It's also why copying the spreadsheet from an existing location gives you a number that looks precise yet means nothing.
Retail revenue forecasting for a location that hasn't opened yet relies on analog matching (comparable stores, either from your own portfolio or industry benchmarks if you're opening your first few units), trade area demographics, foot traffic, competitive density, and category trends, all feeding into one model. Get the inputs wrong and the model doesn't save you. Get them right and you'll have an accurate number that'll be the key to your businesses long term success.
Here's the method, the choices you'll need to make, and the two places most forecasts quietly fall apart: analog quality and cannibalization.
Why a new store can't be forecast like an existing one
An existing store's forecast is really a projection: take last year's sales, adjust for trend, done. A new store has no "last year." The model has to infer performance from a location that has never had a single customer walk through the door, which means every input is external.
It's why choosing the right location matters more here than anywhere else in the business: get the inputs wrong at this stage and no amount of good marketing and business fixes it later. A useful forecast blends five things: analog store performance, trade area demographics, foot traffic and accessibility, competitive density (including cannibalization against your own stores), and category or market trends. None of these work alone. A site with excellent foot traffic and no matching demographic will underperform a quieter street with perfect visitor profiles.
Foot traffic, much like catchment area, must be measured properly to be useful, counted in front of the specific door, by hour and day, not estimated from how busy the neighborhood feels. But manual counts along go so far, and that's what ai site selection tools do so well.
Category trends are the input people skip, and they shouldn't be. It means the growth or contraction rate of your retail category in that specific trade area: is quick-service coffee still opening net new units in this city, or is the category saturated and consolidating? A candidate site can score well on demographics and foot traffic and still be a weak bet if the category itself is shrinking locally, because a declining category drags down every store in it regardless of how good the individual location looks. Basically, if comparable stores in a growing category trade area have added 8% to same-format sales (comparable, like-for-like sales) over two years while stores in a flat or shrinking category trade area have been roughly stagnant, that difference should shift your forecast up or down by a similar margin.
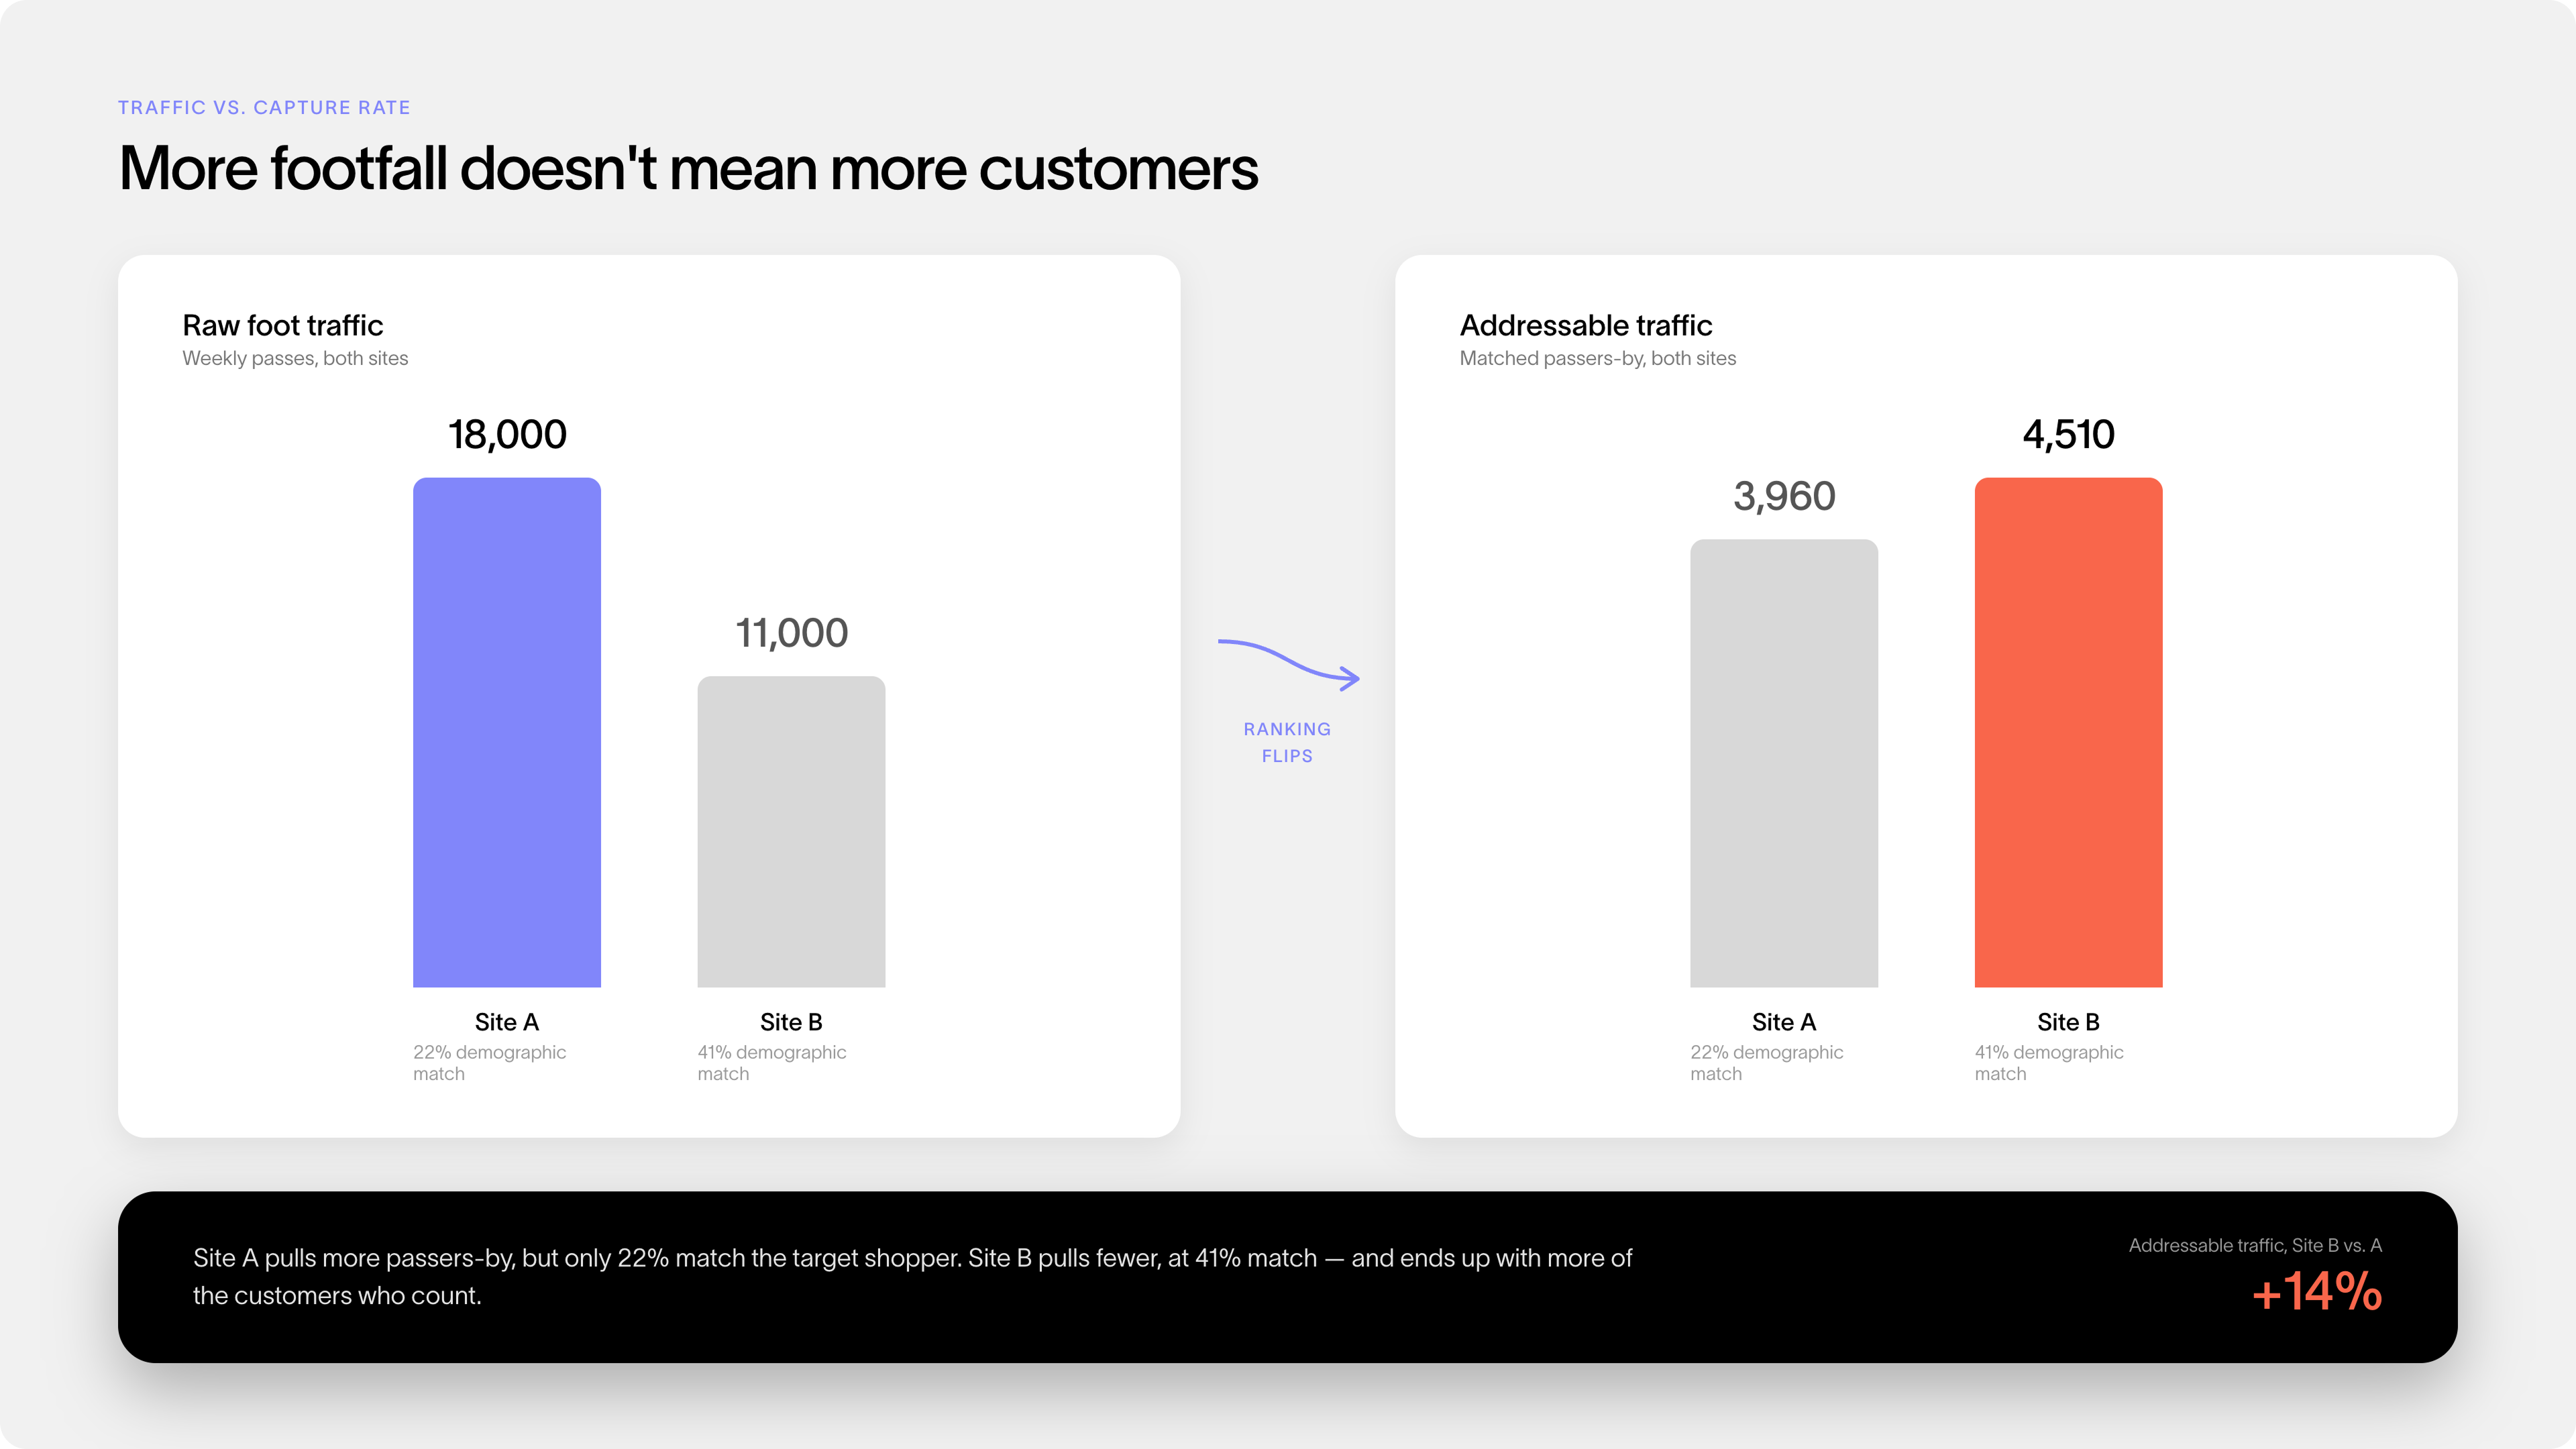
Say you're comparing two candidate sites for a mid-size grocery format. Site A sits on a high-traffic commuter street: 18,000 weekly pedestrian passes, but only 22% match your target household profile (families, mid income, car-owning). Site B has 11,000 weekly passes, in a residential trade area where 41% of the catchment matches the same profile. Raw traffic favors Site A by 64%. Addressable traffic flips it: Site A delivers roughly 3,960 matched passers-by, Site B delivers 4,510. The number that predicts revenue is the second one, not the first, and it's the one most gut-feel forecasts never calculate.
What data you actually need before you start
None of the above works without the right data. At minimum: trade area boundaries built from real visitor movement rather than a fixed radius, demographic and income data for that trade area, foot traffic counts at the candidate address itself, a map of competitive density within the trade area, and your own store-level revenue for analog matching.
Every one of these should be dated. Demographic data from five years ago in a fast-changing neighborhood will make an otherwise sound model wrong without anyone noticing. Foot traffic patterns shift with new transit lines, new competitors, and new anchor tenants faster than most people think.
Analog matching: the core of the method
Analog matching is the backbone of new-store forecasting, and it works by finding stores that share the new site's trade area profile. That match can come from your own network or, if you don't have one yet, industry benchmarks. Either way, you then use that comparable store's real performance as your baseline.
The quality bar is specific: at least three comparable stores, matched on demographics, foot traffic, and competitive density, not on proximity or "it's in a similar kind of town." Two stores in the same region can have completely different trade area compositions, and a single analog gives you too little data to work with. Three or more analogs let you build a range instead of guessing at a single figure, and the range is what actually holds up when someone asks how confident you are.
If you're opening your first unit or expanding into a market where you have no comparable stores, industry benchmarks (average sales per square foot, or per cover, in comparable trade areas) fill the gap until your own data exists. They're weaker than a true analog because they're not calibrated to your specific brand, but they're still better than an unsupported number.
Analog matching works the same way for a restaurant chain choosing its next location as it does for retail.
Here's what a real analog set looks like for a candidate restaurant site in a mid-size French city. Store 1, in a comparable secondary city, does €620,000 a year with a 39% match on demographics and traffic. Store 2, in a similar-density suburb, does €580,000 with a 44% match. Store 3, in a town with a slightly older population, does €510,000 with a 31% match, the weakest of the three but still above the minimum bar. Weighting each store by its match strength (roughly 34% to Store 1, 39% to Store 2, and 27% to Store 3) pulls the estimate toward Stores 1 and 2 and away from the weaker Store 3, landing the candidate site in a range of roughly €560,000 to €610,000. That range comes from visible math, not from picking whichever store happens to be down the road.
.webp)
Choosing a model that matches your data
Once the inputs are gathered, something has to turn them into a number. Which model works depends on how much store history you have and how linear the relationships between your variables and revenue actually are.
- Regression works well once you have 15 or more comparable stores and the relationship between inputs and revenue is roughly straight-line: more foot traffic, more matching demographics, more revenue, in predictable proportions.
- Decision trees handle it better when the relationship is conditional rather than linear, for instance when foot traffic only matters above a certain demographic threshold.
- XGBoost and other ensemble methods combine many decision trees and tend to win on accuracy when you have a large, rich dataset, at the cost of being harder to explain without additional tools.
- Categorical scoring, which sorts candidate sites into performance bands (high, medium, low) rather than producing a dollar figure, is the right choice for brands with too few stores to support a precise regression. It's still useful for screening even if it can't drive a capital allocation decision on its own.
No single method wins across the board. A five-unit franchise testing its second market shouldn't be running the same model as a 200-store chain with a decade of point-of-sale data. The right question isn't "which model is best," it's "which model fits what I actually have."
To see why, take a hypothetical chain with eight stores that tries an ensemble method because it promises the highest theoretical accuracy. In this scenario, the model keeps returning a number close to the network average for every candidate site, which is useless for telling a strong location apart from a mediocre one: eight stores simply isn't enough data for a method built to spot subtle non-linear patterns across hundreds of variables. Switching to a simpler regression, with fewer variables but a dataset that actually supports them, would produce a forecast the team can be used against what they already know about their business. More sophisticated isn't the same as more accurate, and it's rarely more defensible.
Cannibalization and catchment area analysis
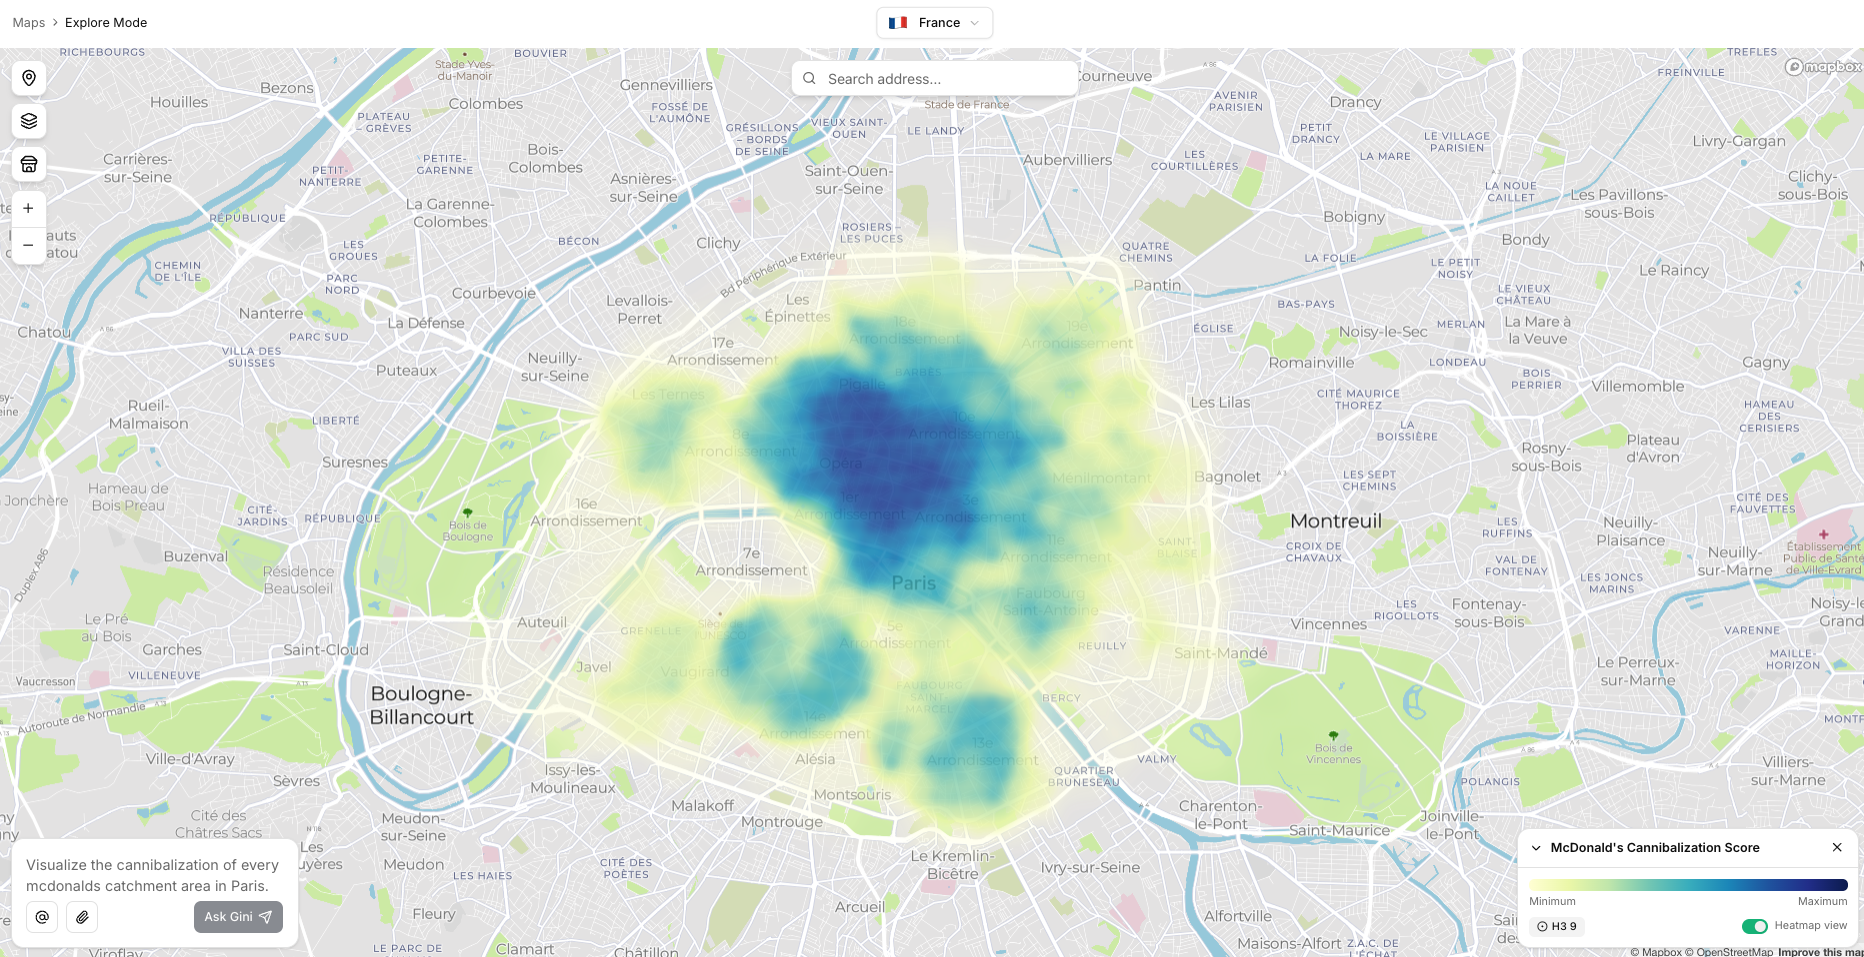
A forecast that looks at a candidate site in isolation is only telling half the story if you already operate nearby. Cannibalization measures how much of a new store's projected revenue would be pulled from an existing location rather than captured as genuinely new demand, and it starts with catchment area analysis, the same trade area concept from earlier, just applied to two stores at once so the overlap between them becomes visible: not a circular buffer around each store, but the actual area people travel from to reach it, built from real mobility patterns rather than as-the-crow-flies distance.
A catchment built on mobility data catches overlap that a distance-based map misses entirely, because two stores four kilometres apart can still draw from the same commuting corridor, which is exactly what real catchment area analysis is built to surface before it shows up as a disappointing month-one revenue number.
Here's why the distinction matters with real numbers. Say a retailer's existing store's catchment area overlaps 35% with the catchment area of a candidate site four kilometres away. If the new site is forecast to generate €900,000 in year-one revenue and the catchment overlap holds at 35%, a reasonable estimate is that roughly €315,000 of that comes from customers who would otherwise have shopped at the existing store, leaving around €585,000 in genuinely incremental revenue. That's the number that should go into the business case, not the headline €900,000.
Retailers commonly accept cannibalization up to 30% to 40% of a new store's projected revenue if the opening still adds positive incremental profit to the network overall. The 35% overlap in the example above sits inside that range. It's a borderline case, not a red flag: the site can still go ahead as planned, provided the €585,000 in incremental revenue still clears the return the business needs to see. Above 40%, the conversation changes. The new store may still be worth opening, but the business case then needs to weigh the loss at the existing location against the gain at the new one, not treat the two as separate decisions.
Making a forecast survive being questioned
A forecast that can't answer "how did you get this number" doesn't survive contact with a finance or expansion committee, no matter how sophisticated the model behind it. Three things separate a defensible forecast from a black box.
First, name the variables that actually drive the number. If foot traffic contributes 30%, analog match contributes 25%, and competitive density reduces the projection by 10%, the team presenting the forecast should be able to say so, not point at a dashboard and shrug.
Second, present a range, not a single figure, and know how to talk about the error behind it. Accuracy here is usually measured as MAPE, mean absolute percentage error: how far off the model's predictions run, on average, from actual results. A forecast of "€1.1 million to €1.4 million with a 75% confidence band" is more honest, and more useful, than a single point estimate that implies precision the underlying data doesn't support. Traditional forecasting methods typically run a MAPE of 20% to 35%, while machine-learning methods bring that down to 8% to 20%; Gini by MyTraffic's forecast mode has reached 9% MAPE in internal tests. Even the tighter range is still a range, and it should be presented as one.
Third, show the cannibalization math for any site near an existing store.
Keeping the model honest over time
A forecasting model isn't a deliverable you build once and file away. Markets shift, store formats change, and a model trained on data from three years ago drifts out of step with how your stores actually perform today, and nobody notices until the numbers stop matching reality.
Revisit the model at least once a year, and sooner if you've opened several new stores (each one is new training data), entered a different type of market, or changed your format. What keeps a forecast accurate as a business grows isn't a smarter one-time build, it's better data feeding the model and more frequent recalibration against real results.
What this means for your next site
A defensible revenue forecast isn't the output of a single formula. It's five inputs (analog performance, demographics, foot traffic, competitive density and cannibalization, category trends) run through a model that fits your data, checked against a real catchment area rather than a distance buffer, and revisited on a schedule rather than left to age.
None of this requires a data science team to get right, but it does require the underlying data: real trade area boundaries, actual visitor movement, and analog stores matched on more than "they're roughly similar." Gini by MyTraffic's forecast mode trains directly on your own network's performance, selects the best model for your use case, all to predict revenue for any candidate address, with an error margin you can see and defend rather than take on faith.
Before you take a number to committee, run it through the checklist that matters: can you name the top three variables driving it, does it account for cannibalization against your own stores, and would the range still make sense if you're wrong by 15%? If the answer to any of those is no, the forecast isn't ready yet, whatever the spreadsheet says.
Frequently asked questions
Is there a formula for forecasting retail revenue?
Not a single one. Retail revenue forecasting blends many different inputs (analogs, demographics, foot traffic, competitive density, category trends) through a model chosen to fit your data, regression, decision trees, XGBoost, or categorical scoring, then adjusts the result for cannibalization if you already operate nearby.
What are the main revenue forecasting methods?
Regression works once you have 15 or more comparable stores and a roughly linear relationship between inputs and revenue. Decision trees handle conditional relationships better. XGBoost and other ensemble methods win on accuracy with large, rich datasets. Categorical scoring, sorting sites into high, medium, or low bands, suits brands with too few stores for a precise regression.
How do you calculate projected revenue for a store that hasn't opened yet?
Find at least three comparable analog stores, matched on demographics, foot traffic, and competitive density rather than proximity. Weight each one by how closely it matches the candidate site, then use their real performance to build a revenue range. A single analog gives you one data point dressed up as a forecast.
How much cannibalization is acceptable when opening near an existing store?
Retailers commonly accept 30% to 40% cannibalization of a new store's projected revenue if the opening still adds positive incremental profit to the network overall. Above 40%, the business case needs to weigh the loss at the existing location against the gain at the new one, not treat them as separate decisions.
How accurate is retail revenue forecasting?
Accuracy is usually measured as MAPE, mean absolute percentage error. Traditional forecasting methods typically run 20% to 35%; machine-learning methods bring that down to 8% to 20%. A forecast should always be presented as a range with a confidence band, not a single point figure that implies precision the data doesn't support.