

.jpg)

.jpg)

.jpg)
Follow us on
Foot traffic data measures how many people visit a place, when they come, and where they travel from. It turns real-world movement into decisions about where to open, invest, renew, or walk away.
Now imagine.
Two shops sit on the same street, fifty metres apart. One signs a lease at €8,000 a month and thrives. The other signs at €8,000 a month and closes within a year. That's because the rent being identical, the foot traffic volume and quality weren't.
That gap is the entire reason foot traffic data exists.
It tells you how many people pass and enter a location, when they come, and where they travel from, so the choice to open, renew, or pass rests on a real number instead of a gut feeling. Physical retail is still where most decisions get made: in 2025, browsing in-store remained the top way shoppers discovered new products in France (69%), the UK (58%) and Germany (57%), according to Retail Week's European consumer research.
The store still matters. Guessing about it is what got expensive.
This guide covers what foot traffic data is, the small but important difference between foot traffic and footfall, how it gets measured, how accurate it really is, who uses it, and how to choose a platform built for a European market rather than an American one.
What is foot traffic data?
Foot traffic data measures the number of people who visit a physical place over a given period, plus when they arrive and where they come from.
It converts real-world movement into a metric you can compare, track, and act on.
A raw headcount is the floor, not the ceiling.
Modern footfall analytics goes further: how long people stay (dwell time), how often they return, the route they took to get there, and the profile of who they are. A count tells you a place is busy. Foot traffic data tells you whether that crowd is your crowd, where they came from, and whether they will come back. That is the leap from a number to a decision.
The discipline sits inside a fast-growing market. The global location intelligence market was worth around $25 billion in 2025 and is forecast to reach $52.67 billion by 2030, a 13.45% annual growth rate, per Mordor Intelligence, with retail and consumer goods the single largest buying vertical. Foot traffic is the raw signal underneath most of it.
Foot traffic vs footfall: same thing, two continents
Foot traffic and footfall mean the same thing: pedestrian visits to a place. The split is geographic, not technical.
"Foot traffic" is the common term in the United States.
"Footfall" is the standard term in the UK and across much of Europe. A retail director in Manchester and one in Dallas are asking the identical question in different words.
Who uses foot traffic data?
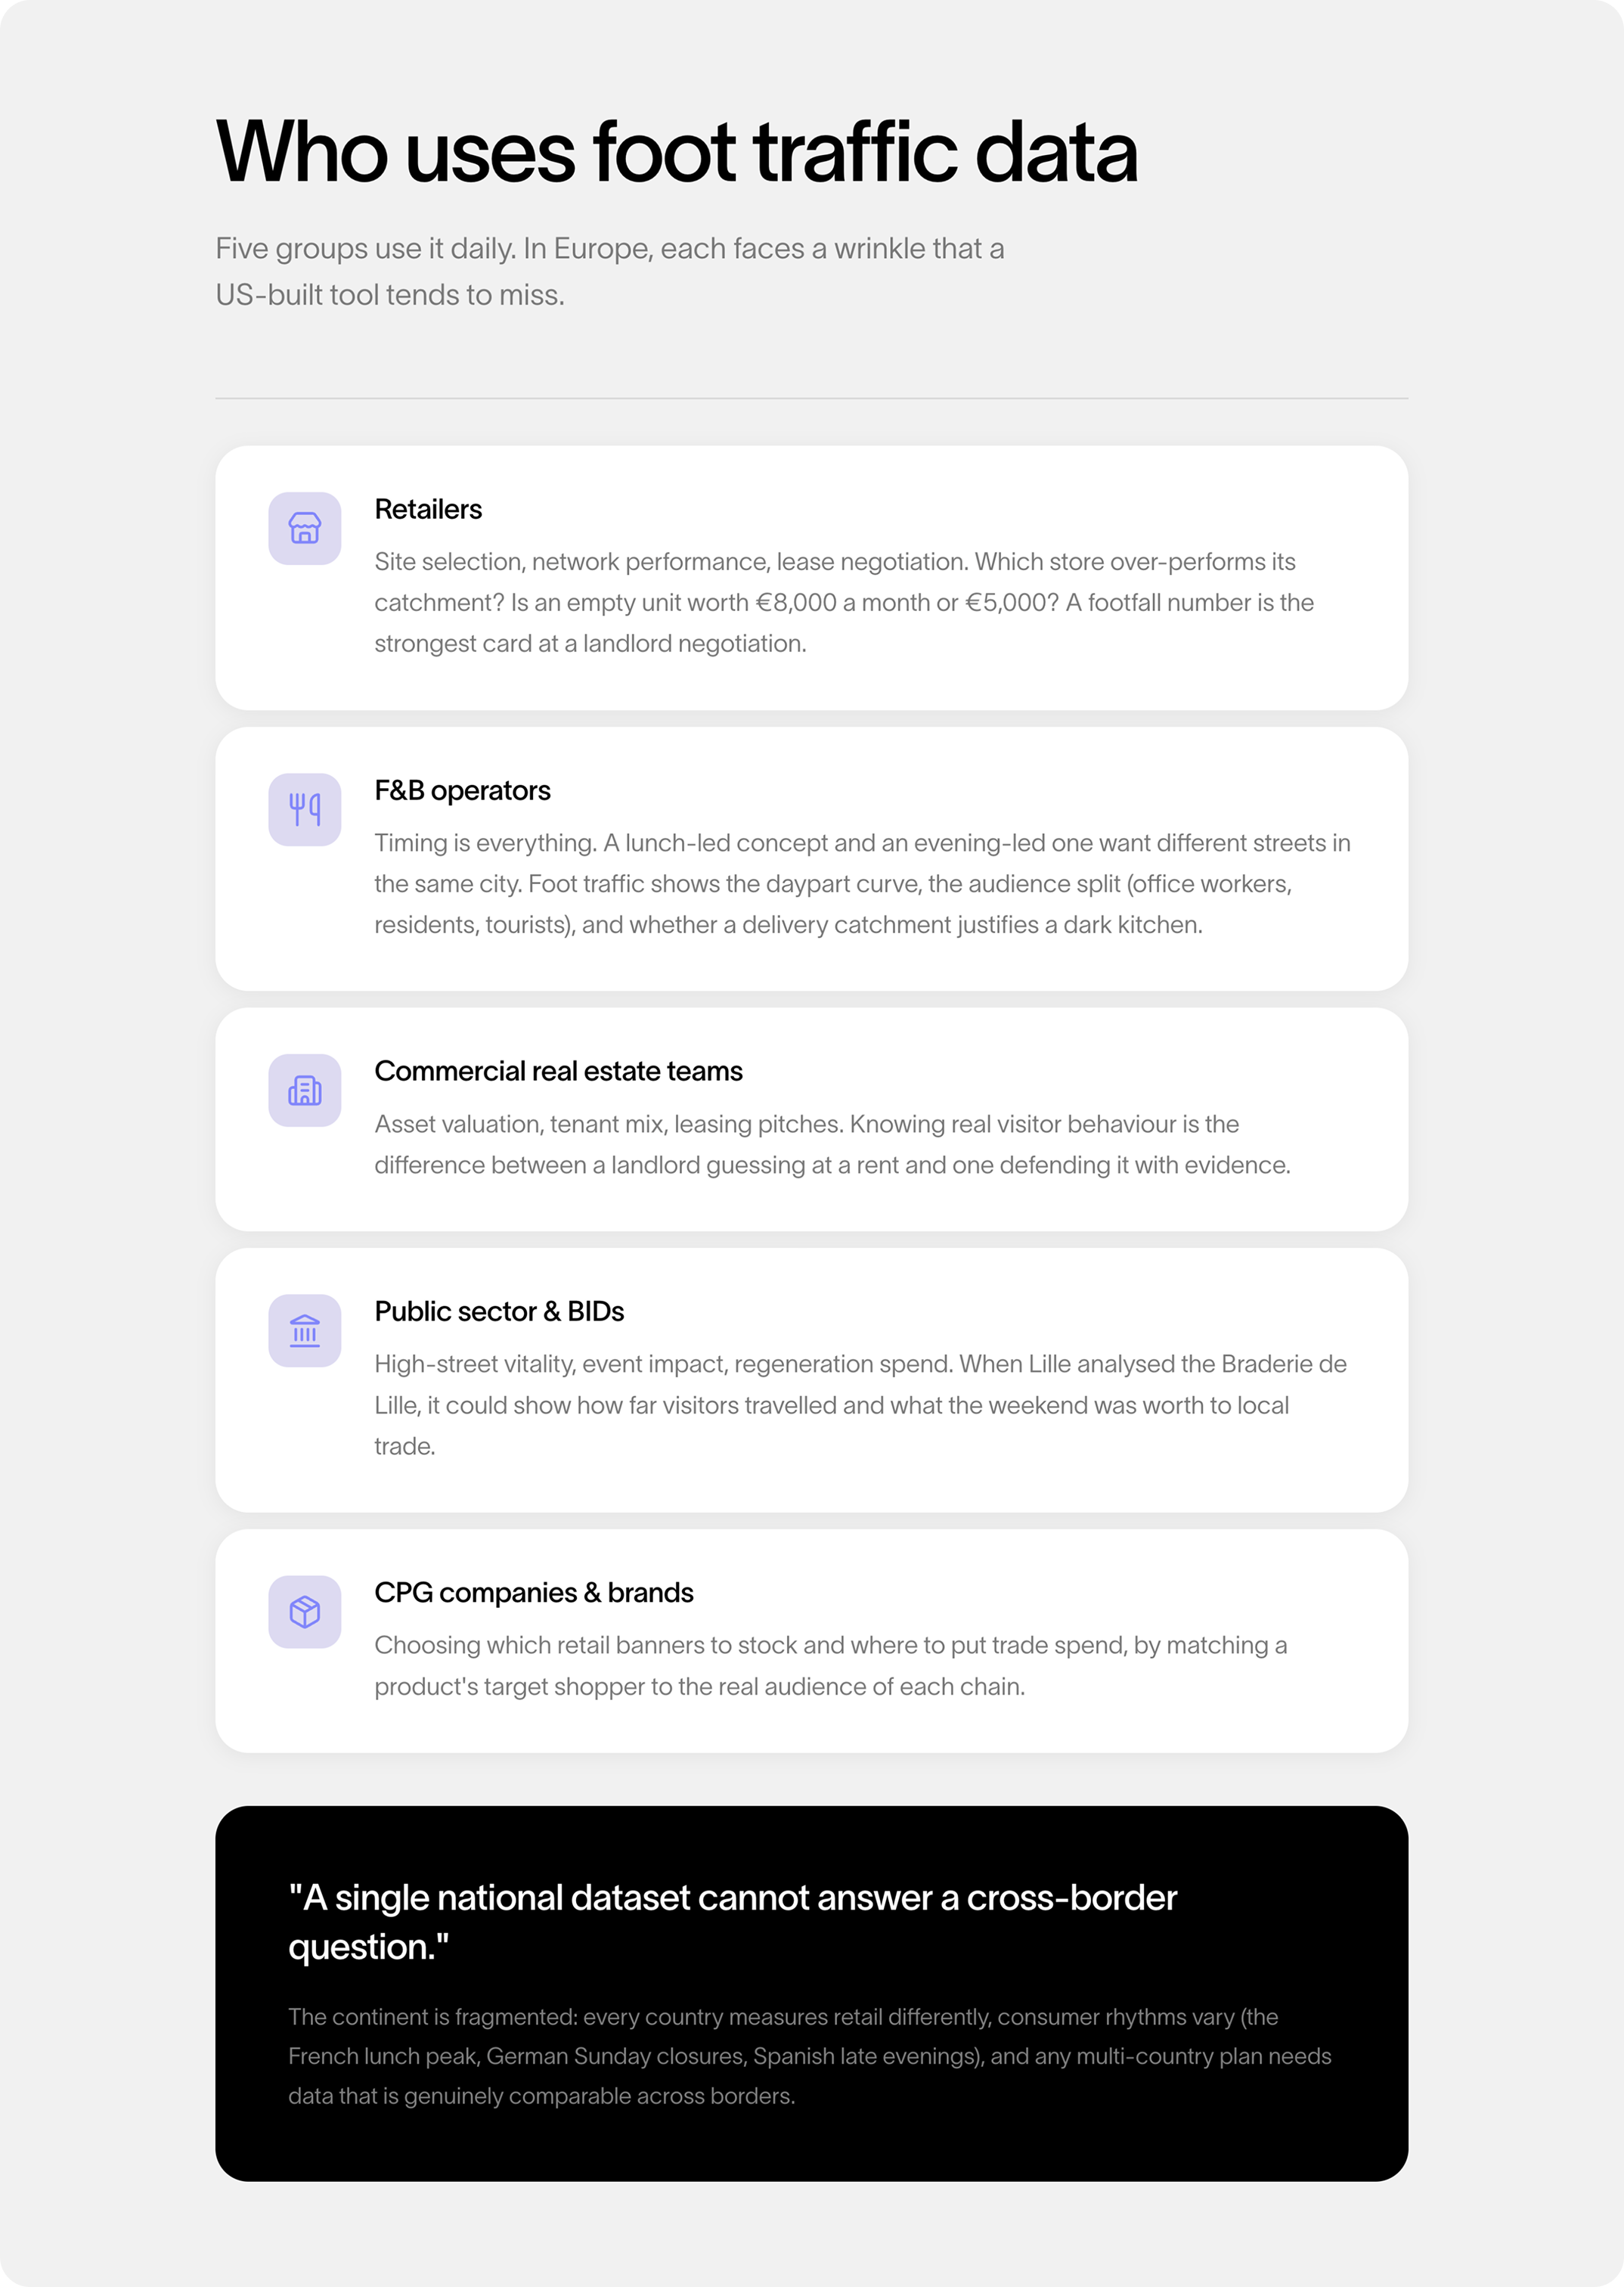
Five groups rely on it daily, and in Europe each one faces a wrinkle that a US-built tool tends to miss.
Retailers use it for site selection, network performance, and lease negotiation. Which of my stores over-performs its catchment, and which underperforms a good one? Is this empty unit worth €8,000 a month or €5,000? A footfall number is the strongest card you can bring to a landlord. You can see exactly how US retailers turned foot traffic data into a site-selection advantage, and the same logic applies street by street in Europe.
F&B operators ask a sharper version of the question, because timing is everything.
A lunch-led concept and an evening-led one want different streets even in the same city. Foot traffic data shows the daypart curve, the split between office workers, residents and tourists, and whether the delivery catchment justifies a dark kitchen instead of a dining room.
Commercial real estate teams use it to value assets, fix tenant mix, and win leasing pitches. Knowing how mobility data reveals real visitor behaviour in commercial real estate is the difference between a landlord guessing at a rent and one defending it with evidence.
Public sector bodies, BIDs and city-centre managers track high-street vitality, measure the pull of an event, and justify regeneration spend. When we analysed the footfall behind the Braderie de Lille, we could finally understand how far visitors travelled and what the weekend was worth to local trade.
FMCG brands use it to choose which retail banners to stock and where to put trade spend, by matching a product's target shopper to the real audience of each chain.
The European lens runs through all five. The continent is fragmented: every country measures retail differently, consumer rhythms vary (the French lunch peak, German Sunday closures, Spanish late evenings), and any multi-country plan needs data that is genuinely comparable across borders.
A single national dataset cannot answer a cross-border question.
How foot traffic data is actually measured
There are three main ways to count people, and they are not equal. Most guides stop at "we use mobile data."
The honest version is more useful.
Hardware sensors and people counters (cameras, infrared beams, 3D sensors) sit at a doorway and count who walks through. They are precise inside the door and blind outside it. They tell you how many people entered your shop. They tell you nothing about the market around it, who those people were, or where they came from. Strong for internal operations, useless for site selection.
Telco and GSM data comes from a mobile network operator. The coverage is wide, but the sample is tied to that one operator's subscribers, so it skews toward wherever that network is strong and misses everyone on rival networks. You get a big number with a built-in bias.
Mobile GPS panels are what modern footfall analytics platforms use for market-level measurement. They draw anonymised location signals from a large panel of opted-in devices, then translate that movement into visit counts for any place you define.
From raw signals to a real number
A GPS panel never sees everyone. It sees a sample: a subset of devices in a given area. The platform then extrapolates. It weights that sample against known population and demographic data so that, say, a few percent of observed devices can stand in for the whole population. The logic is the same as an election poll. You do not interview every voter; you interview a representative sample and scale it up.
The quality of the final number depends on three things: how big the panel is in that specific country, how representative it is of the real population, and how well the platform calibrates the extrapolation. This is exactly why coverage depth by country matters so much in Europe, and why a platform with a deep French or German panel will beat one that treats Europe as an afterthought.
How accurate is foot traffic data, really?
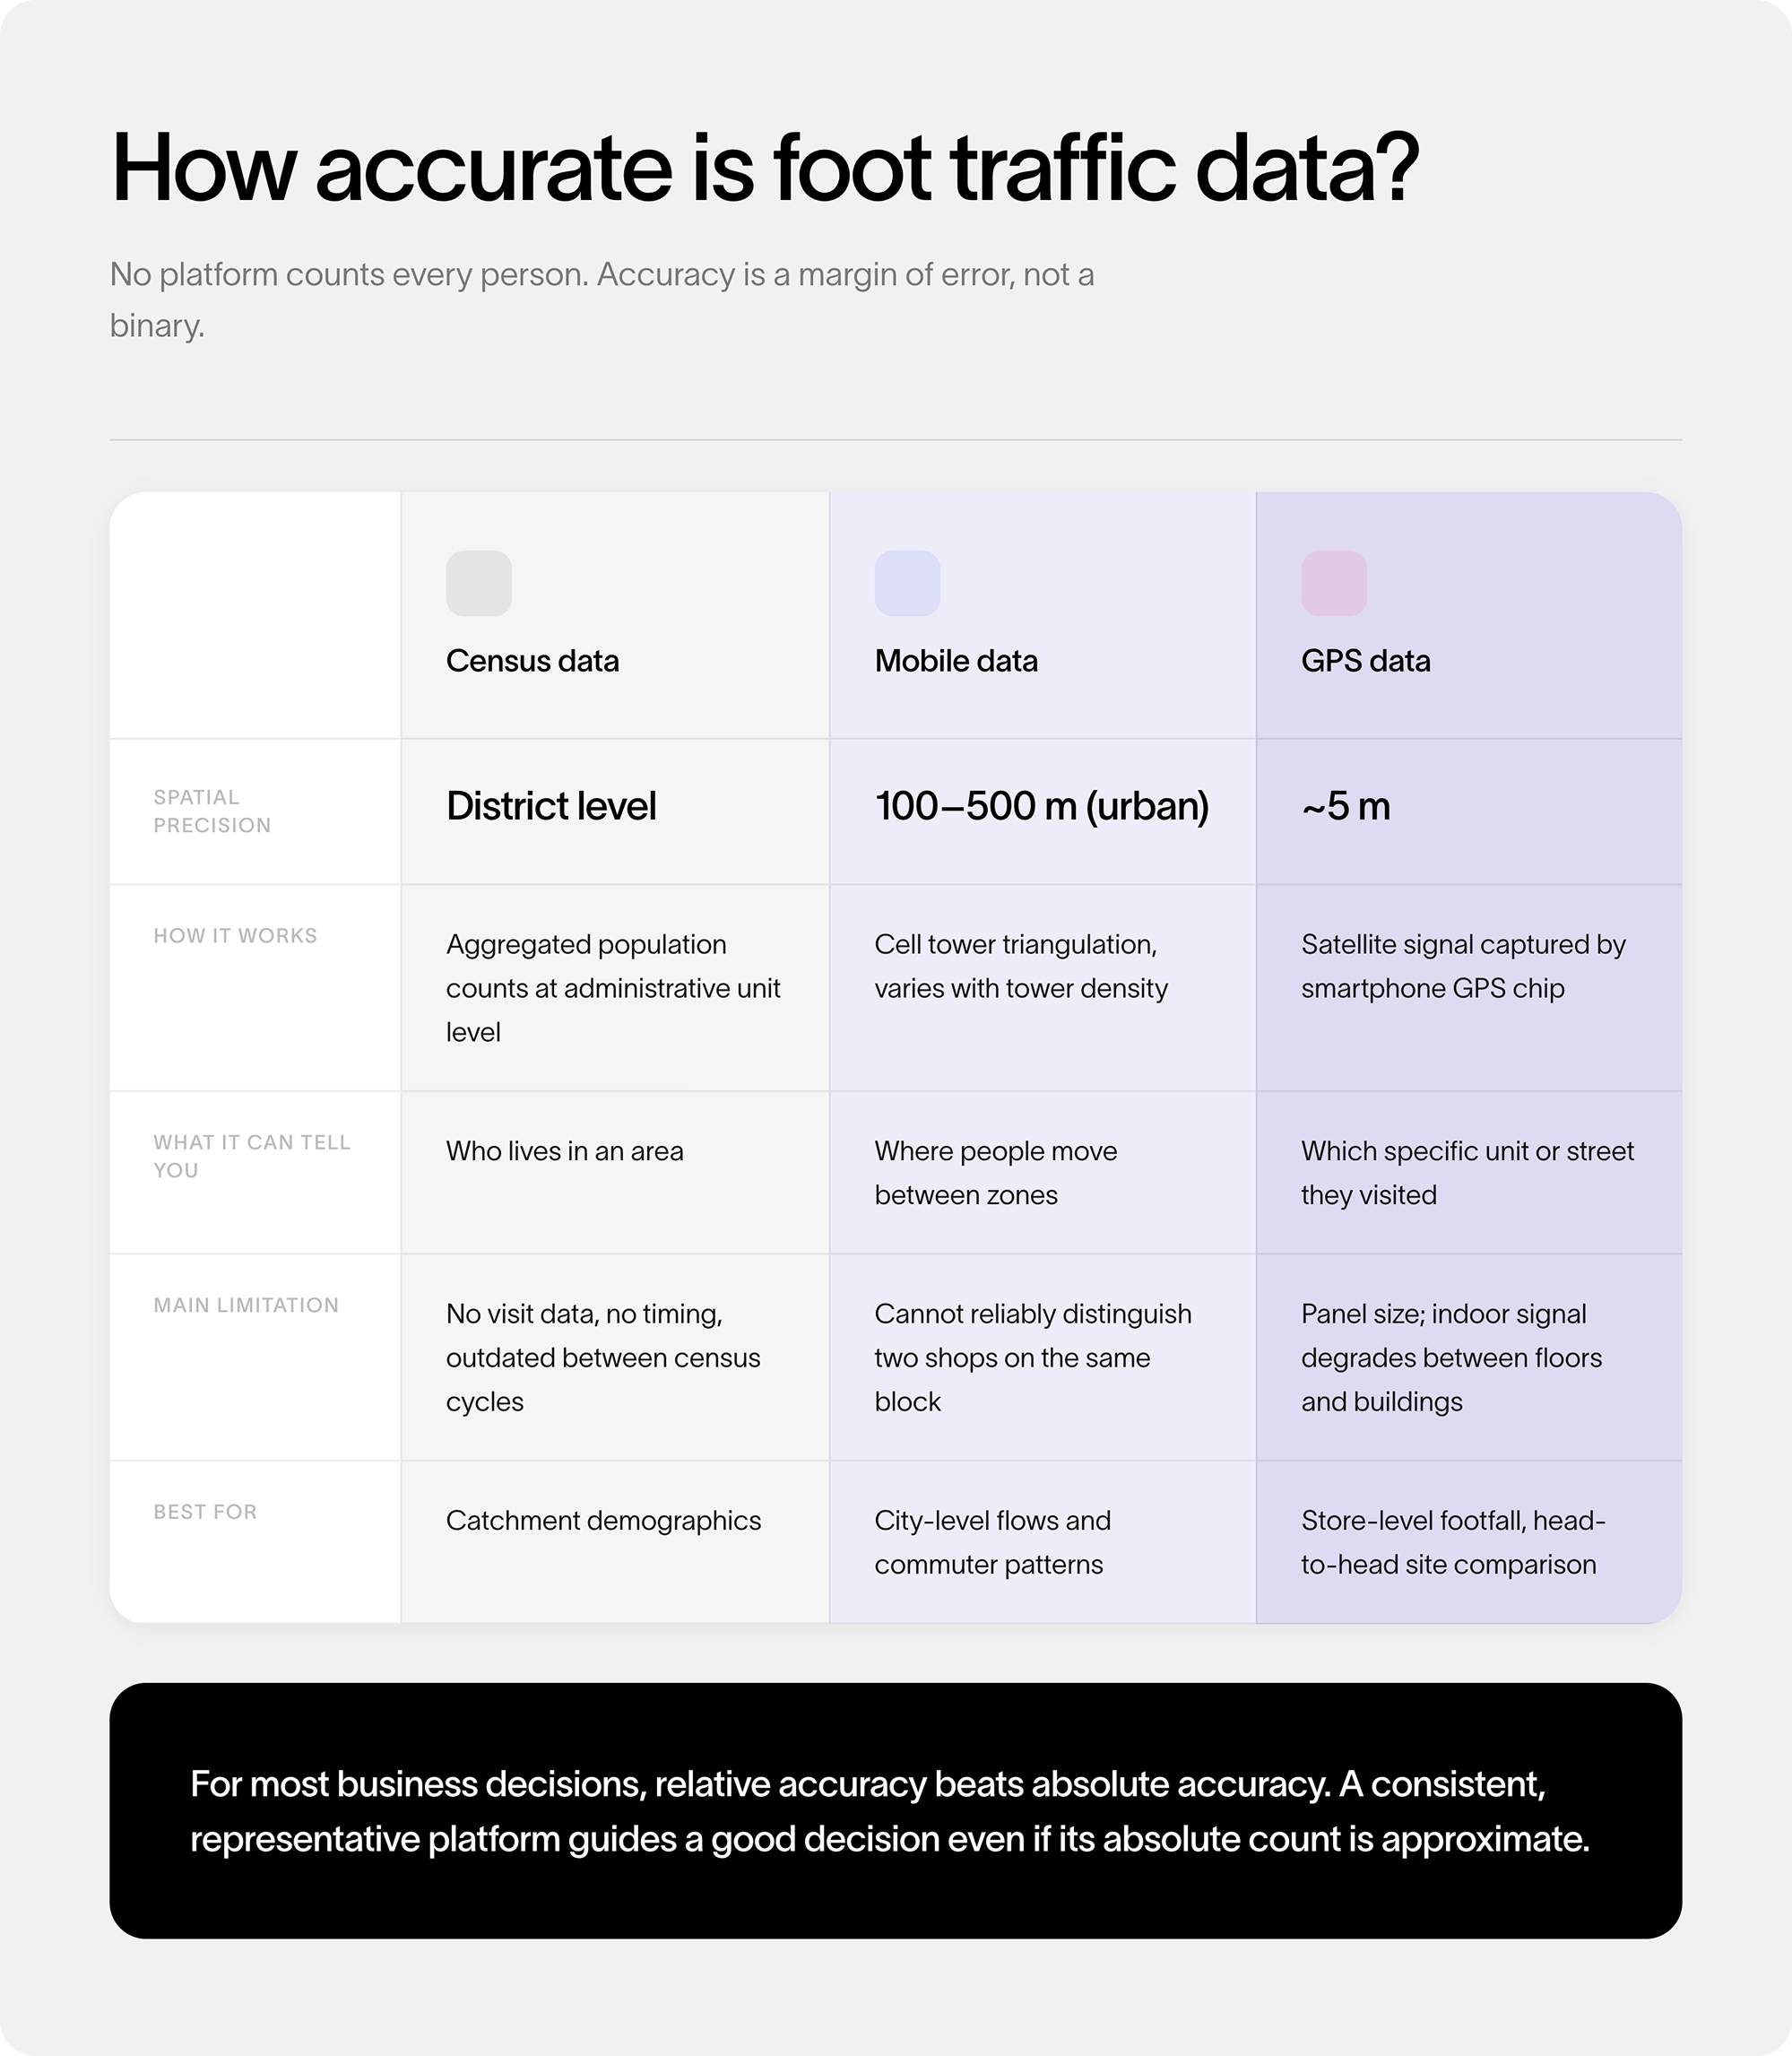
No platform counts every person, and any vendor who claims otherwise is probably lying.
Accuracy is best understood as a margin of error, and that margin grows in three situations: when the panel is thin in a particular country, when the area is dense or indoor (GPS signals drift between floors and neighbouring buildings), and when the time window is short (one quiet Tuesday is far noisier than a full month).
Here is the part that reframes the whole question. For most business decisions, relative accuracy beats absolute accuracy. You rarely need to know that exactly 41,206 people passed a unit last month. You need to know that this unit gets roughly 30% more footfall than the one two streets over, consistently, across a representative period.
Comparison is where the value lives. A platform that is consistent and representative will guide a good decision even if its absolute count is approximate.
So the right questions to ask a vendor are simple: do you publish your methodology, how do you validate against ground-truth counts, and how deep is your panel in my market? Honesty about limits is a sign of a serious data partner, not a weak one.
Foot traffic data and privacy: the GDPR reality
In Europe, location data is personal data the moment it can point back to a person, and that single fact reshapes how footfall analytics has to work.
The GDPR's own definition of personal data explicitly names location data as an identifier. A raw GPS trail tied to a device is personal data. For foot traffic data to sit outside GDPR's scope, it has to be stripped of identifiers so thoroughly that no single person can be picked back out. France's regulator, the CNIL, applies one of the strictest readings in Europe: it treats anonymisation as an irreversible process and warns against ever treating a raw dataset as anonymous. Re-identification has to be impossible in practice, not merely difficult.
This is where a European guide has to part ways with an American one. US-written resources tend to frame privacy around removing names and advertising identifiers, which suits a market governed by state laws and rising regulatory enforcement on geolocation. Europe starts from a higher, continent-wide bar on day one. The practical consequence: a platform built in the US and later extended to Europe tends to treat GDPR as a compliance bolt-on. A European-first companion like Gini by MyTraffic treats aggregation and irreversible anonymisation as the starting point, because it was built under those rules. For a European operator, that is not a footnote. It is the difference between a defensible data trail and a liability sitting on your servers.
Foot traffic data in action: three worked examples
A retail chain rebalancing its network
A grocery operator runs 40 stores and suspects some are quietly eating each other. Foot traffic data shows which locations pull from overlapping catchments and cannibalise each other's visitors, and separates two very different problems: a weak store in a genuinely weak catchment, versus a weak store in a strong catchment that is simply being run badly. The first should close or relocate. The second should be fixed, not closed.
Reading footfall to understand the whole commercial network turns a vague "two stores are struggling" into a precise list: close one, relocate one, reinvest in two.
An F&B brand planning a three-country expansion
A fast-casual chain is live in France and wants Germany and Spain next. The risk is treating all three markets the same. Foot traffic data lets the team measure a Berlin high street, a Madrid one, and their proven Lyon flagship on the same yardstick: total footfall, the daypart curve, and the origin mix of office workers, residents and tourists. The data shows that Madrid's visitor profile mirrors their best French sites while one shortlisted Berlin street peaks at the wrong time of day. The decision: lead with Madrid, hold Berlin, and rescout. This is the cross-border comparison a single-country tool cannot make.
A city centre proving an event worked
A mid-size European city runs a weekend festival and has to prove the return to fund it again. Footfall data shows the uplift over a normal weekend, how far visitors travelled (day-trippers versus people who stayed overnight), and which streets captured the spillover and which stayed empty.
The verdict is concrete: keep the festival, and move two underused stages onto the streets that the data showed were starved of traffic. The budget conversation stops being a debate and becomes a number.
How to choose a foot traffic data platform
Most footfall tools answer "how many people came." The better question for a buyer is "will this help me decide, in my market, this week." Five things separate a real decision partner from a data export.
A short decision framework follows from those five:
- If you only need to count who enters one shop, an in-store sensor is enough.
- If you need to understand the market around a location, where visitors come from, and how you stack up against rivals, you need market-level footfall analytics built on a GPS panel.
- If you operate across several European countries, prioritise European data depth and comparability over American brand recognition. A US dashboard knows American malls. It does not know your high street.
- If you need an answer this afternoon rather than a three-week data project, prioritise a companion that returns a decision. Gini by MyTraffic was built for exactly that: ask it about any European address in plain language and get the footfall, the catchment, and the recommendation back, without a data team in the room.
The world has enough charts.
The advantage now belongs to whoever gets from question to decision fastest.
Frequently asked questions
What is foot traffic data?
Foot traffic data measures how many people visit a physical location over a set period, when they arrive, how long they stay, and where they travelled from. It turns pedestrian movement into a metric businesses use for site selection, network performance, lease negotiation, and marketing.
What is the difference between foot traffic and footfall?
None, beyond geography. Both describe pedestrian visits to a place. "Foot traffic" is the common term in the United States, while "footfall" is standard in the UK and most of Europe. The word a tool or report uses is a clue to which market it was built for.
How is foot traffic measured?
Three main ways: hardware sensors that count people entering a building, telco data tied to one mobile operator's subscribers, and anonymised mobile GPS panels that measure visits across a whole market. Modern footfall analytics platforms rely mainly on GPS panels, then extrapolate from a representative sample to the full population.
How accurate is foot traffic data?
No platform counts every visitor, so accuracy is a margin of error rather than a perfect figure. That margin widens in dense or indoor areas, in countries with thin panels, and over short time windows. For most decisions, consistent relative accuracy (comparing one site to another) matters far more than the exact absolute count.
Is foot traffic data legal under GDPR?
Yes, when handled correctly. Location data is personal data under GDPR, so it must be aggregated into statistics and anonymised irreversibly before use, following standards set by regulators such as France's CNIL. European-first platforms build this in from the start rather than adding it on later.
Which foot traffic data tool is best for European markets?
Look for genuine data depth in your specific countries, a recent refresh rate, demographic and origin detail, and a fast path from question to answer. Gini by MyTraffic was built European-first, on real mobility data across 18 countries, and returns a decision rather than a dashboard.
How do you use foot traffic data to negotiate a lease?
Pull the verified footfall for the unit and its street, compare it to similar locations and to what the rent implies, and bring that number to the table. A landlord asking €8,000 a month has a harder case when the data shows the traffic supports €5,000.
Where foot traffic data goes next
Three shifts are already underway. First, AI is moving footfall analytics from a dashboard you read to an answer you ask for, in plain language, in seconds. Second, the gap between presence and conversion is widening: PFM Intelligence's 2025 footfall report found passers-by rising faster than actual retail visits across European markets, which means the quality of footfall now matters more than the raw count. Third, European data depth is becoming a real differentiator as the continent's retail recovers: CBRE reported European footfall up 1.7% and retail sales up 2.3% in 2025, with vacancy falling to 5.6%. The recovery is real, and it is being decided street by street.
Your next lease, your next opening, your next closure: each one is a bet. Foot traffic data turns the bet into a calculation. Ask Gini by MyTraffic what the footfall really is at any European address, and walk into the negotiation with the numbers already on your side.
To resume
Foot traffic data turns real-world pedestrian movement into decisions about where to open, invest, and negotiate. This guide covers what it is, how it's measured, how accurate it really is, GDPR, and how to pick a European-first platform.